
Do you remember my story about the January TRREB stats, and how in the first week of February, agents were all waiting with bated breath to find out what the ‘new’ average home price was?
And do you recall my telling a similar version of this story one month later?
In both cases, I can say, “We knew the stats would be crazy, but we didn’t realize just how crazy they’d be.”
Well folks, the same can now be said of the June TRREB stats, only in the complete opposite way.
In Monday’s blog, I talked about “The Road Ahead” for our real estate market and what to look out for, as well as which factors would most greatly affect the market.
I mentioned that, on the heels of an average home price in the month of May that clocked in at $1,212,806, I figured we’d likely see a decline in that figure this month, somewhere below $1,190,000.
What did I not expect?
An average home price of $1,146,254.
If you listen carefully, you can hear the market bears rejoice!
But if you listen even more carefully, you can also hear snickering from the bulls, who recall the bears predicting a 20% drop in the market when the average home price was at $800,000, so suffice it to say, the recent decline doesn’t let the two-decade perma-bears off the hook.
Looking over the TRREB stats today, I’m thinking the exact same thing as I did in February and March, but just the numbers are upside down. I mean, I knew it wasn’t going to look good, but I was quite surprised at just how not-good it looks.
Every TRB reader is going to have a different set of emotions while reading today’s blog, and it all depends on where that person finds him or herself in the market.
A lot of real estate agents have a problem with me talking about the market declining, and they’re experiencing anger and resentment.
Many would-be buyers are on cloud nine, feeling happy, excited, and optimistic, while others share those emotions, but also feel nervous and confused. Totally fair.
Some recent buyers are too busy feeling happy and fulfilled, living in their new house or condo, to dwell on a short-term market decline, but other buyers are feeling a sense of loss, and confusion, and some might feel regret, but I would encourage those to consider that they never set out to day-trade real estate.
Current sellers are feeling hard-done-by, and they’re frustrated. Some are either understanding of, or slowly learning market dynamics, and others are incorrigible.
So let’s take a look at last month’s numbers, and just to provide some context, we’ll start with sales from month of May, just to add context:

I published this in last month’s blog about TRREB stats, pointing out that the 7,283 sales recorded in the month of May are the lowest in TRREB history (since 2002), save for the pandemic-riddled year of 2020.
Here are June’s stats:

To quote Run DMC:
“It’s like that, and that’s the way it is…”
On the heels of the second-fewest sales in the month of May, in the history of TRREB, we saw the fewest sales in the month of June, in the history of TRREB.
This is beyond coincidence, folks.
The three interest rate hikes, with one more on the way, have clearly forced many buyers to sit and wait for the dust to settle. It’s not lack of inventory that’s affecting sales, but rather the desire to buy.
As for the year-over-year sales data, we saw a 41.4% drop in June sales; from 11,106 in June of 2021 to 6,474 this year.
Where did we see that drop take place?
It was actually quite evenly spread:

The difference between a 32.1% drop in Durham and a 49.8% drop in York isn’t all that great a difference, as I believe these stats could fluctuate, month-to-month.
Sales are down. Period.
They’re down by half in York and a third in Durham, and that’s simply because Durham has a lower entry-level house price, so there’s likely more action.
If we look at the month-over-month decline, it simply undermines the numbers above:
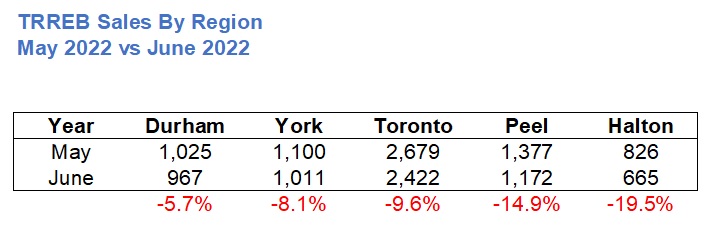
Here, we see Durham and York side-by-side, rather than being at other ends.
As I said, we’re bound to see fluctuation, month-to-month. And with an average decline of 41.4%, being made up of a low of 32.1% and a high of 49.8%, it’s safe to simply conclude, “sales are down, across the board.”
How does this affect the average home price?
Here’s what happened from April to May:

Toronto held in.
Durham got rocked.
York, Peel, and Halton were all hurting.
Here’s what happened from May to June:
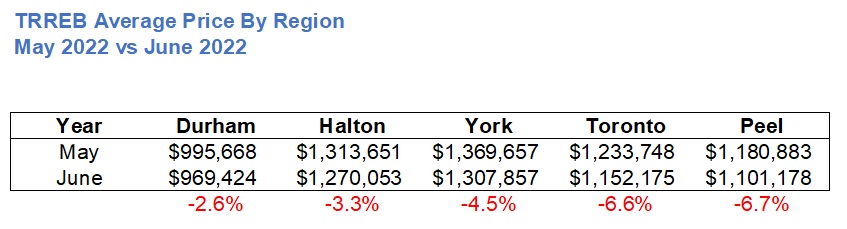
How very interesting that Durham went from largest-decline to smallest-decline.
Toronto, on the heels of a 0.7% decline, aka a rounding error, dropped 6.6%, month-over-month.
But if we look at the cumulative effect on housing prices from the so-called “peak” in February to the June price, Toronto still remains the outlier:
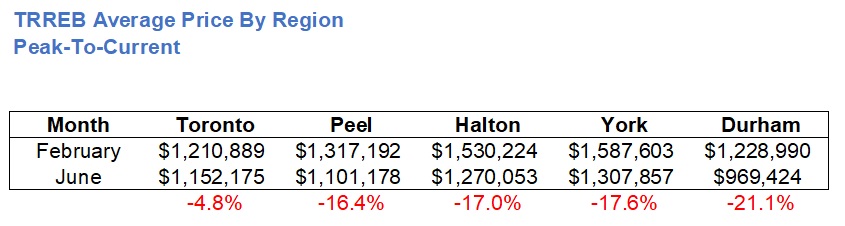
That’s quite telling!
Once again, Durham and Toronto are at opposite ends, with Peel, Halton, and York representing the middle.
Actually, it’s hard to suggest they’re any sort of “middle,” since the true middle between Toronto’s 4.8% and Durham’s 21.1% would be 13.0%, and Peel, Halton, and York are all well past that.
As we’ve noted before, the 416 area continues to outpace the suburbs.
Now, how about we look at the month-over-month rates of appreciation/depreciation in each region since January?
This chart is quite interesting:

This chart starts in January, but note that the appreciation/depreciation is based on December’s price.
The TRREB average is down 1.0%, and Halton, Durham, Peel, and York are all down, yet Toronto is somehow up by 12.6%. Part of that is because the December home price was very depressed in the 416 compared to the rest of the fall figures, but it’s also a testament to the strength of the 416.
Now, I’m going to skip “new listings” and “active listings” and simply jump right to the interaction between sales/listings, or supply/demand.
Let’s look at the sales-to-new-listings ratio (SNLR) in each region, in each month, and trace how they’ve moved:
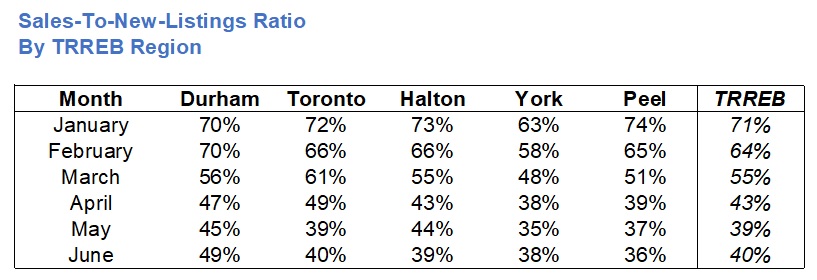
Some people will say that anything less than a 50% SNLR points to a buyer’s market, but I don’t believe that. I think the 50% mark is too convenient a figure. In reality, I believe under 40% points to a buyer’s market.
Well, that’s where we’re headed, folks.
The TRREB average dipped to 43% in April, 39% in May, and for some reason, went up modestly, to 40% in June.
But note that in the month of June, Halton, York, and Peel were all below 40% and Toronto was at 40%.
And while you could argue that the 49% SNLR in Durham suggests a more balanced market, the fact that the average home price from February to June has had the sharpest decline of all five regions in Durham – at 21.1%, tells us that the 49% SNLR is meaningless.
As for SNLR in the month of June, generally speaking, that 40% figure corresponding to the whole of TRREB is quite significant.
Why?
Well, because it continues the theme that we started at the top…
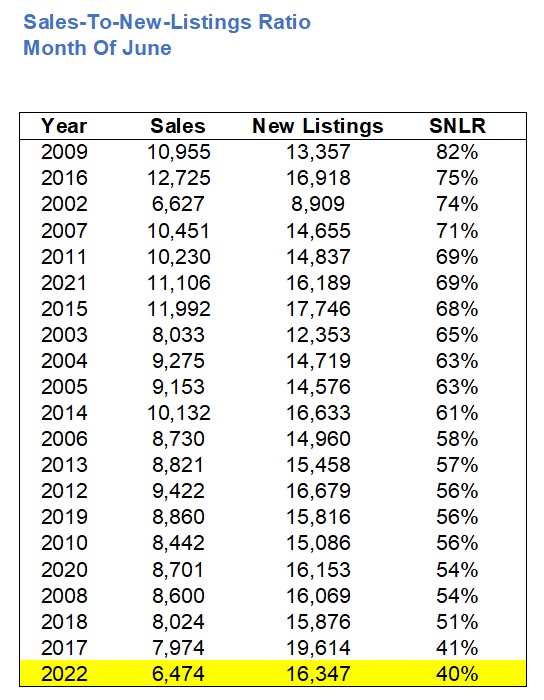
Last month saw the lowest SNLR in the month of June since this data began in 2002.
So then, are there any positives to come from the June TRREB data?
Well, if you own in the 416, I think you’re pleased to see that your decline, on average, is about one-quarter that of the other regions.
And overall, many of us are ready to suggest that this is the worst of the market.
With rates set to increase on July 13th, I could see July’s data looking poor, and maybe even August too.
But here’s my prediction, folks: the market will normalize in the fall.
I’ve never seen a data set like this, and while some bears might suggest it’s “merely the start” or “a sign of things to come,” I watched the market bounce back very quickly in 2008 and 2020, and while I don’t think it’ll happen quite that quickly, I do think that media articles about “pain” should be looking present and past, rather than into the future.
NB:
We have never posted a “stats” blog on a Friday, which is a day that Matthew teases is “mail it in Friday.”
I have always felt that the monthly stats blogs are the most important, so because TRREB was seemingly asleep this week and we didn’t get the stats until Thursday, I had to post this on Friday!
As a result, the post will remain up on Monday, and we’ll have new blogs on Tuesday & Thursday, aka the “holiday week schedule,” per Derek.
A holiday. Wow. What a concept…


Condodweller
at 3:49 pm
All the bulls are speechless. Or all TRB readers are with Rogers.
Bal
at 9:03 pm
LOL@Condodweller
Vancouver Keith
at 4:33 pm
“It’s different this time!” The decline in demand is because of a new factor – inflation driving interest rates up. The real estate market has been bailed out, and driven higher over and over again by measures that increased liquidity in the market. Remember zero down, 40 year mortgages?
We haven’t seen this kind of inflation driven interest rates in a long time, and unless inflation dies in hurry rates are going high enough to put us in recession within a year. It’s a new market.
No one has calculated the tipping point, a la the Big Short but at some level yet to be determined, there is a vast increase in people who have to sell, facing demand that has disappeared waiting for even higher rates and lower prices. We likely won’t get there, but if we do – look out below.
Condodweller
at 5:14 pm
The full Sir John Templeton quote is “The four most expensive words in the English language are “This time it’s different”
But I agree. I always said interest rates and jobs are the big contributors to affordability. We sustained this 20+ year price increase using all the tricks in the book (low rates, high-paying tech jobs, bank of mom and dad etc.). At some point, it’s gotta end. That’s another quote from a money manager. Nothing can continue forever. If it can’t continue, it must stop. Well find how strong psychology is and how willing buyers are going to be to step in with falling prices. Post 89 it took seven years, just saying.
JL
at 9:21 pm
Glad you also observed that we’ve been “using all the tricks in the book” to keep the party going; I’ve been thinking the same and routinely raising this point during the last run up. That is, if we’ve tapped all the available sources of funding to the max limit (as we appear to have done), at some point there wont be more funding fuel to add to the price fire, so is there a point when it finally has to at least plateau if not fall (for lack of funding, even if not for lack of demand). Maybe we’re finally getting to that point now.
Bryan
at 10:53 am
I think there is one trick left to prop up the housing market; unprecedented levels of immigration. With how much the immigration system weights “having money” to qualify, bringing in a ton of new people will likely infuse a ton of new capital into the housing market…. and we just had the biggest quarter for immigration since they started keeping records. Unemployment is also at the lowest level since reliable records started as well, so the record immigration seems sustainable in the medium term.
How exactly that has an impact, I am not sure though. It is not particularly normal for new immigrants to instantly show up and purchase houses in Rosedale. More likely, this plays in the rental market? If rents surge does that entice investors? Do interest rates win out? Interesting times…
Appraiser
at 7:12 am
So a market that had already accelerated in excess of 40% year over year by December, and then commenced the new year by zooming at an annualized rate of 90% through January and February finally fizzled out. Thank goodness.
Reality check: House prices year over year for the month of June are still up 5.3% from 2021, and the composite HPI index is ahead by 17.89% over last year.
The average cost for a detached home in the ”six” is a measly $1.79 Million.
Oh, and rents are climbing.
tspare
at 7:46 am
Thanks for the hard work and a great read.
Jenn
at 8:55 am
Rogers is back!! Lol
David good thing you left this post up for another day that was karma!!
Appraiser
at 7:02 am
“Canada’s population growth at highest level in more than 30 years, 113,700 new immigrants arrived in Canada in the first quarter of 2022.”
https://www.cicnews.com/2022/07/canadas-population-growth-at-highest-level-in-more-than-30-years-0726651.html#gs.60gl3s
Daniel
at 8:30 am
The average home price was 900k at the start of the pandemic and now it’s $1.15m. That alone feels like unsustainable appreciation. The fact that avg home price rose about $1.3m will be a footnote in history down the line when prices are higher.
Lauzy
at 10:18 am
“Many would-be buyers are on cloud nine, feeling happy, excited, and optimistic.”
Except that their stock portfolio is down over 50% and no longer have the downpayment required to purchase.
JF007
at 11:39 am
and Interest rates are rising at the rate of knots to levels not seen in years and only way EMI can be afforded if either you stop eating and have a house or you put a large enough down payment in excess of 30% probably to afford housing at current levels..i have a mortgage in sub 2% levels and i think i might have to start putting some money aside every month just in case by 2025 the rates haven’t climbed enough to keep my monthlies to current levels..and i need to prepay some of the outstanding to keep my monthly budget sane..
JeMeSouviens
at 1:23 pm
Anybody here old enough to remember the late ’80s? As in 1988?
Mxyzptlk
at 4:27 pm
Sure, I remember 1988. The average home price in the GTA rose by 21.43% year-over-year. Then prices went up another 19.19% in 1989. And they’d previously increased by 27.34% in 1986 and 36.12% in 1987.
In other words, between 1985 and 1989, prices increased by 150.88%. So if you think that’s where we are now, as you seem to imply, I’d suggest you check your calculator.
Condodweller
at 10:12 pm
Yeah, my parents nearly pulled the trigger on a pre-con condo around that time and despite everyone telling them to buy while your can afford it, they held off and were able to buy a townhome a few years after the crash.