Real Estate Marketing & Beyond
The latest housing report from Realtor.com® unveils a bustling Spring real estate season ready for enthusiastic homebuyers. In February, the number of homes available for sale rose by 14.8% compared to the previous year, continuing a trend of increasing inventory for the fourth month in a row.
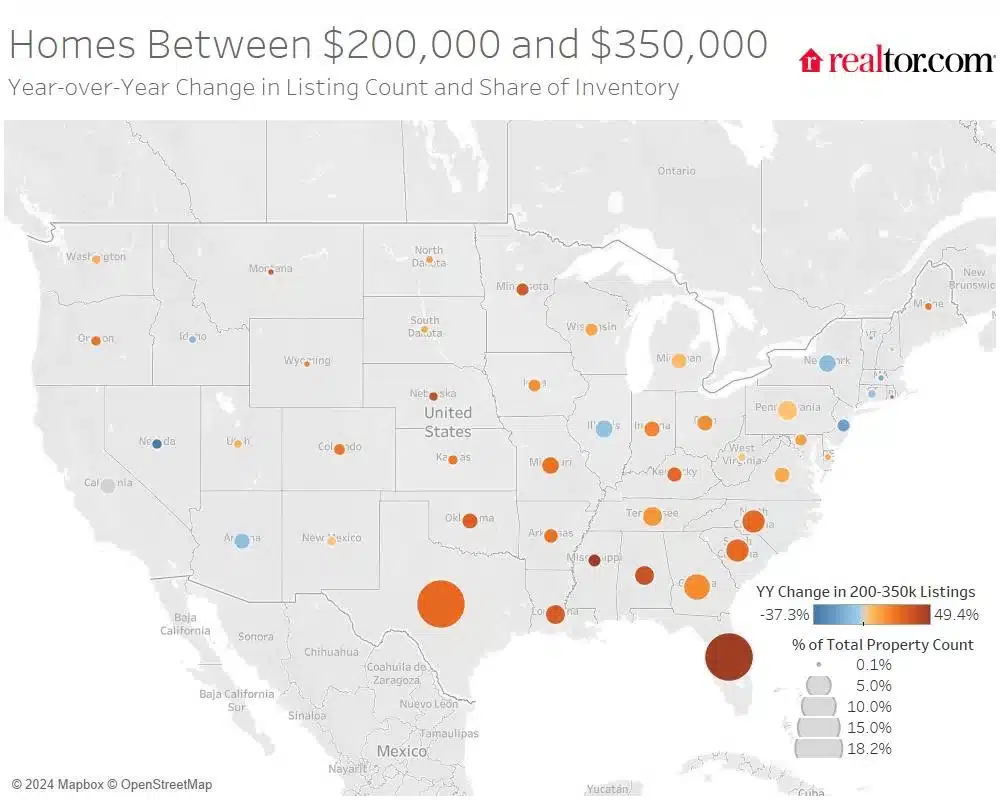
There has been a significant increase in affordable housing options, particularly for homes priced between $200,000 and $350,000, which saw a surge of 20.6% from the previous year, outperforming all other price segments. This increase in the availability of affordable housing indicates promising conditions for home seekers on a budget, suggesting a broader selection compared to previous years as the market prepares for the upcoming lively spring home-buying season.
In the Southern metros, there has been a notable increase in home inventory, as 29 out of the 50 largest metros reported more homes for sale compared to the previous year. Orlando, Miami, and Tampa experienced significant inventory growth, with Orlando leading at 38.5%, followed by Miami at 37.4%, and Tampa at 36.3%. Three Southern metros in Texas, including San Antonio, Austin, and Dallas, have exceeded inventory levels from the typical 2017 to 2019 period, unlike most other metros still working to reach pre-pandemic levels.
The ever-changing nature of mortgage rates has introduced a level of uncertainty into the market. In the past few months, mortgage rates have been around 6.6%, but they rose to 6.94% after a surge caused by an inflation report. Sellers are demonstrating a willingness to adapt, as the percentage of homes offering price reductions has increased from 13.2% last year to 14.6% this year, indicating a change in market dynamics. It's worth mentioning that there was an 11.3% surge in newly listed homes compared to the previous year, making it the fourth month in a row with increased listing activity following a 17-month decline.
February 2024 Housing Overview by Top 50 Largest Metros
| Metro Area | Median Listing Price | Median Listing Price YoY | Median Listing Price per Sq. Ft. YoY | Active Listing Count YoY | New Listing Count YoY | Median Days on Market | Median Days on Market Y-Y (Days) | Price Reduced Share | Price Reduced Share Y-Y (Percentage Points) |
| Atlanta-Sandy Springs-Alpharetta, Ga. | $409,000 | 2.3 % | 4.1 % | 10.4 % | 15.7 % | 43 | -8 | 15.4 % | 0.5 pp |
| Austin-Round Rock-Georgetown, Texas | $542,000 | 2.1 % | 3.2 % | 8.1 % | 13.9 % | 60 | -10 | 20.8 % | -5.3 pp |
| Baltimore-Columbia-Towson, Md. | $330,000 | 1.9 % | 4.2 % | 2.4 % | 2.5 % | 44 | -5 | 11.4 % | 0.1 pp |
| Birmingham-Hoover, Ala. | $286,000 | 5.7 % | 5.6 % | 24.2 % | 14.9 % | 65 | 2 | 13.2 % | -0.1 pp |
| Boston-Cambridge-Newton, Mass.-N.H. | $854,000 | 6.9 % | 10.3 % | -3.3 % | 5.9 % | 33 | -5 | 7.7 % | -2.1 pp |
| Buffalo-Cheektowaga, N.Y. | $251,000 | 10.4 % | 13.6 % | -4.5 % | -0.4 % | 67 | 5 | 5.3 % | -0.2 pp |
| Charlotte-Concord-Gastonia, N.C.-S.C. | $400,000 | 0.7 % | 5.9 % | 4.7 % | 13.1 % | 45 | -10 | 14.5 % | 0.6 pp |
| Chicago-Naperville-Elgin, Ill.-Ind.-Wis. | $360,000 | 6.7 % | 6.8 % | -13.4 % | 0.5 % | 40 | -4 | 8.9 % | -0.8 pp |
| Cincinnati, Ohio-Ky.-Ind. | $337,000 | -6.4 % | 4.3 % | 26.2 % | 10.3 % | 39 | -10 | 10.9 % | 1.2 pp |
| Cleveland-Elyria, Ohio | $212,000 | 6.5 % | 7.9 % | -5.7 % | 1.2 % | 50 | -3 | 10.8 % | -0.9 pp |
| Columbus, Ohio | $377,000 | 4.7 % | 5.4 % | 22.1 % | 5.2 % | 38 | -2 | 15.8 % | 3.4 pp |
| Dallas-Fort Worth-Arlington, Texas | $435,000 | 0.0 % | 1.6 % | 25.4 % | 20.0 % | 48 | -11 | 19.2 % | 2.8 pp |
| Denver-Aurora-Lakewood, Colo. | $610,000 | -3.6 % | 6.2 % | 30.0 % | 17.6 % | 35 | -8 | 14.8 % | 1.3 pp |
| Detroit-Warren-Dearborn, Mich. | $229,000 | 0.0 % | 2.3 % | -4.8 % | 2.8 % | 46 | -9 | 11.3 % | -2.9 pp |
| Hartford-East Hartford-Middletown, Conn. | $400,000 | 0.9 % | 5.3 % | -2.7 % | -6.3 % | 41 | 7 | 5.8 % | 0.7 pp |
| Houston-The Woodlands-Sugar Land, Texas | $360,000 | 0.4 % | 1.8 % | 16.2 % | 16.1 % | 48 | -6 | 16.8 % | 1.1 pp |
| Indianapolis-Carmel-Anderson, Ind. | $319,000 | 5.5 % | 7.2 % | 12.4 % | 2.8 % | 59 | 0 | 16.0 % | 0.9 pp |
| Jacksonville, Fla. | $410,000 | 5.2 % | 5.6 % | 22.6 % | 21.6 % | 51 | -13 | 20.8 % | 1.1 pp |
| Kansas City, Mo.-Kan. | $421,000 | -4.9 % | -2.4 % | 1.7 % | 20.0 % | 73 | -8 | 10.8 % | 2 pp |
| Las Vegas-Henderson-Paradise, Nev. | $465,000 | 4.4 % | 5.6 % | -39.3 % | -2.9 % | 40 | -25 | 13.4 % | -8.6 pp |
| Los Angeles-Long Beach-Anaheim, Calif. | $1,137,000 | 16.8 % | 9.4 % | -4.2 % | 6.3 % | 40 | -12 | 8.9 % | -0.9 pp |
| Louisville/Jefferson County, Ky.-Ind. | $312,000 | 4.1 % | 3.1 % | 12.3 % | 5.3 % | 45 | 1 | 14.7 % | 1.8 pp |
| Memphis, Tenn.-Miss.-Ark. | $325,000 | 0.4 % | 2.7 % | 35.5 % | 11.5 % | 68 | 1 | 18.2 % | 3 pp |
| Miami-Fort Lauderdale-Pompano Beach, Fla. | $550,000 | -8.2 % | -1.3 % | 37.4 % | 20.7 % | 62 | -5 | 19.5 % | 5 pp |
| Milwaukee-Waukesha, Wis. | $354,000 | 1.2 % | 4.4 % | -2.0 % | -19.1 % | 37 | 1 | 10.1 % | 0.3 pp |
| Minneapolis-St. Paul-Bloomington, Minn.-Wis. | $434,000 | -0.1 % | 0.2 % | 16.4 % | 37.4 % | 37 | -11 | 8.5 % | 0.9 pp |
| Nashville-Davidson-Murfreesboro-Franklin, Tenn. | $560,000 | 8.2 % | 7.4 % | -2.8 % | 10.3 % | 38 | 0 | 17.3 % | -1.8 pp |
| New Orleans-Metairie, La. | $325,000 | 0.1 % | 0.1 % | 29.3 % | -1.7 % | 83 | 14 | 16.3 % | 0.9 pp |
| New York-Newark-Jersey City, N.Y.-N.J.-Pa. | $750,000 | 10.2 % | 16.6 % | -9.9 % | -3.1 % | 69 | -6 | 6.6 % | -0.7 pp |
| Oklahoma City, Okla. | $323,000 | -7.4 % | -1.5 % | 19.8 % | 14.0 % | 55 | 3 | 18.1 % | 3.1 pp |
| Orlando-Kissimmee-Sanford, Fla. | $435,000 | 0.0 % | 2.6 % | 38.5 % | 11.1 % | 64 | 0 | 19.7 % | 3 pp |
| Philadelphia-Camden-Wilmington, Pa.-N.J.-Del.-Md. | $340,000 | 5.4 % | 6.3 % | -5.8 % | 1.0 % | 59 | -4 | 11.0 % | -0.4 pp |
| Phoenix-Mesa-Chandler, Ariz. | $540,000 | 10.9 % | 4.6 % | -4.4 % | 6.9 % | 45 | -16 | 25.1 % | -0.1 pp |
| Pittsburgh, Pa. | $232,000 | 16.2 % | 12.0 % | 6.1 % | 12.5 % | 75 | -14 | 14.7 % | 1.9 pp |
| Portland-Vancouver-Hillsboro, Ore.-Wash. | $600,000 | -1.2 % | 3.5 % | 21.1 % | 8.9 % | 55 | 2 | 19.1 % | 8.8 pp |
| Providence-Warwick, R.I.-Mass. | $500,000 | 0.4 % | 0.4 % | -8.1 % | 2.3 % | 38 | -7 | 6.8 % | -1 pp |
| Raleigh-Cary, N.C. | $440,000 | -2.2 % | 5.7 % | -6.5 % | 18.0 % | 44 | -22 | 12.1 % | -1.5 pp |
| Richmond, Va. | $449,000 | 14.3 % | 7.7 % | 11.5 % | 8.2 % | 48 | -3 | 8.9 % | 0.8 pp |
| Riverside-San Bernardino-Ontario, Calif. | $595,000 | 6.3 % | 7.5 % | -3.6 % | 7.0 % | 51 | -15 | 12.9 % | -1.1 pp |
| Rochester, N.Y. | $250,000 | 7.5 % | 8.3 % | -5.6 % | 3.8 % | 24 | -4 | 8.7 % | 1.3 pp |
| Sacramento-Roseville-Folsom, Calif. | $633,000 | 4.4 % | 4.6 % | -7.2 % | 6.5 % | 39 | -13 | 10.4 % | -1.8 pp |
| San Antonio-New Braunfels, Texas | $335,000 | -1.5 % | -1.3 % | 26.6 % | 11.0 % | 68 | 1 | 21.2 % | 2.9 pp |
| San Diego-Chula Vista-Carlsbad, Calif. | $997,000 | 6.9 % | 11.4 % | 5.8 % | 8.2 % | 33 | -5 | 10.6 % | 0.5 pp |
| San Francisco-Oakland-Berkeley, Calif. | $989,000 | -1.3 % | -0.6 % | -2.0 % | 6.0 % | 29 | -4 | 7.5 % | -1 pp |
| San Jose-Sunnyvale-Santa Clara, Calif. | $1,367,000 | -2.3 % | -2.7 % | -12.8 % | 16.6 % | 23 | -7 | 5.0 % | -3.4 pp |
| Seattle-Tacoma-Bellevue, Wash. | $765,000 | 2.0 % | 4.1 % | 5.7 % | 41.7 % | 32 | -11 | 7.3 % | -3 pp |
| St. Louis, Mo.-Ill. | $287,000 | 5.8 % | 4.8 % | 12.2 % | 14.1 % | 48 | -16 | 10.5 % | 0.8 pp |
| Tampa-St. Petersburg-Clearwater, Fla. | $416,000 | 3.9 % | 5.6 % | 36.3 % | 25.3 % | 57 | -2 | 25.5 % | 4 pp |
| Virginia Beach-Norfolk-Newport News, Va.-N.C. | $385,000 | 3.5 % | 6.1 % | 9.3 % | 7.2 % | 36 | -2 | 15.1 % | 2.8 pp |
| Washington-Arlington-Alexandria, DC-Va.-Md.-W. Va. | $599,000 | 2.5 % | 5.7 % | -3.5 % | 2.3 % | 36 | -4 | 8.5 % | -0.5 pp |
Explore the Realtor.com® February Monthly Housing Report for a detailed look at market inventory levels, pricing trends, and days on market statistics.