Debt-ceiling drama pushed bond yields up last week, taking mortgage rates to a new 2023 high in the middle of the spring home-selling season. Active housing inventory, thankfully, saw some decent growth last week. Purchase application data had a second straight week of declines.
Here’s a quick rundown of the last week:
- Active inventory grew 8,914 week to week, even though new listing data is still trending at all-time lows in 2023.
- Mortgage rates rose to a 2023 year high of 7.12% as the debt ceiling talks pushed bond yields higher.
- Purchase application data had its second straight week of negative data as the constant theme of higher rates impacted the weekly data.
The 10-year yield and mortgage rates
The White House and Republicans announced a tentative deal on the debt ceiling on Saturday, putting an end to the drama we’ve all had to deal with for the past two weeks.
And on Wall Street, many traders were short the bond market, meaning that a lot of speculative trades were made betting that bond yields would quickly go higher. These two factors sent bond yields shooting up.
Of course, this sent mortgage rates to the yearly high of 7.12% last week, which is the second time this year that mortgage rates have made a 1% move higher from the bottom!
Mortgage rates have been very volatile — even though the 10-year yield hasn’t reached a new high in 2023, mortgage rates have. Since the banking crisis started, the mortgage market has gotten increasingly stressed, and the recent debt ceiling issues didn’t help. As you can see below, this last move higher in bond yields was very sharp.
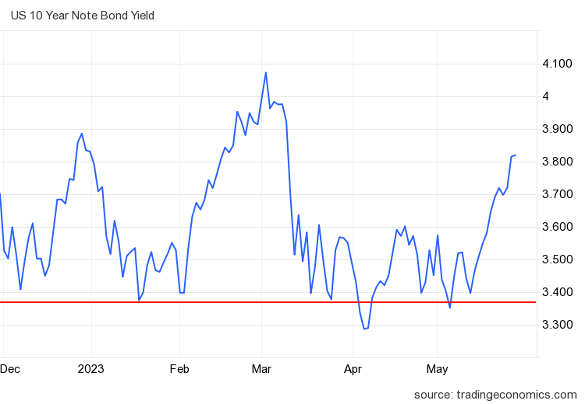
In my 2023 forecast, I wrote that if the economy stays firm, the 10-year yield range should be between 3.21% and 4.25%, equating to mortgage rates between 5.75% and 7.25%. I have also stressed that the 10-year level between 3.37% and 3.42% would be hard to break lower. I call it the Gandalf line in the sand: “You shall not pass.” So far in 2023, that line has held up, as the red line in the chart above shows.
However, even though we haven’t hit my peak mortgage rate call of 7.25%, the mortgage market is much more stressed than I thought it would be in 2023.
This is where the banking crisis and the debt ceiling uncertainty kick in, as I tagged the peak rate of 7.25% with a 10-year yield of 4.25%. The new variable of the banking crisis is important: the debt ceiling issue for now is over unless something unforeseen happens, but the banking crisis and the mortgage stress are still here.
We might get some short-term reprieve in bond yields and mortgage stress. However, the spreads between the 10-year yield and 30-year mortgage rates have worsened since the banking crisis started. It will be critical to see how the bond market and mortgage spreads act this week.
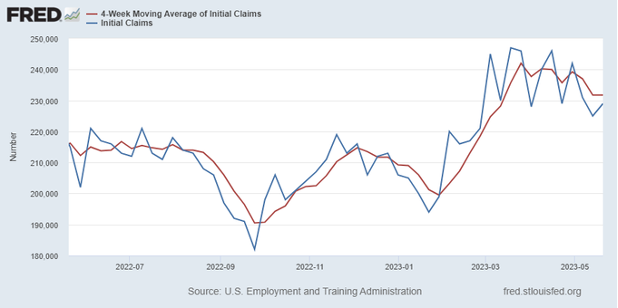
Another aspect of my 2023 forecast was that if jobless claims break over 323,000 on the four-week moving average, the 10-year yield could break under 3.21% and head toward 2.73%. This could push mortgage rates down into the mid-5% level. Right now, the jobless claims data, while rising noticeably from the recent lows, still hasn’t come close to breaking over 323,000 on the four-week moving average. This week is jobs week, with four different labor reports I’ll be watching.
From the St. Louis Fed: Initial claims for unemployment insurance benefits increased by 4,000 in the week ended May 20, to 229,000. The four-week moving average was little changed, at 231,750.
Weekly housing inventory
The growth in active listing inventory has been tepid this year. Some feared a mortgage rate lockdown would prevent inventory from growing this spring, but that’s not the case.
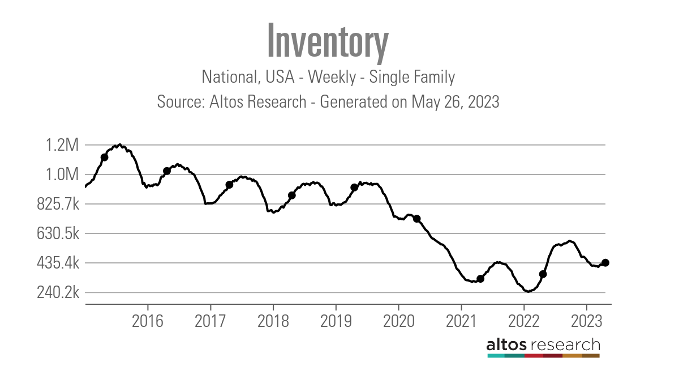
Even though inventory growth has been slow, we are still seeing a spring inventory bump as we do each year; it just hasn’t been very strong. As we can see from the data below, inventory is higher than last year but far from anything we think is normal.
- Weekly inventory change (May 19-26): Inventory rose from 424,190 to 433,104
- Same week last year (May 20-27): Inventory rose from 338,399 to 357,582
- The inventory bottom for 2022 was 240,194
- The peak for 2023 so far is 472,680
- For context, active listings for this week in 2015 were 1,131,405
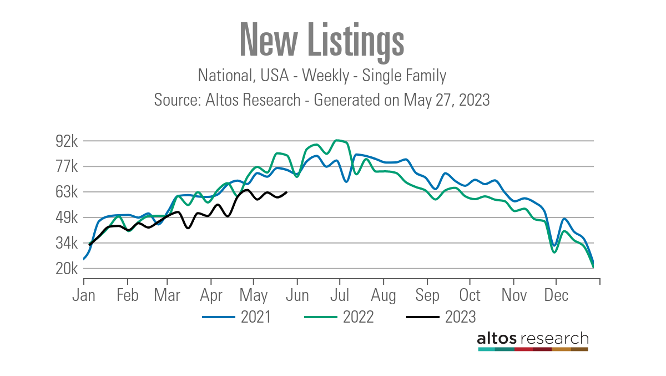
New listing data rose last week, according to Altos Research, but the trend of 2023 having the lowest new listing growth in history is still intact. Even so, let’s remember that there are still people selling homes where they had low mortgage rates to buy homes in a higher rate environment: Total active listings are still higher this year than last.
Here are the new listings data for this week over the last several years:
- 2023: 62,765
- 2022: 83,105
- 2021: 74,984
For this week, I want to stress the big difference between the new listing data in 2023 and the previous two years.
In 2022, when the housing market was dealing with a sharp move higher in mortgage rates, the new listing data grew higher than the same week in 2021. You can make the case that some sellers wanted to list before rates increased even more, and that was reflected in the weekly data.
But after mortgage rates got over 6%, went back to 5%, and then spiked to 7.37%, sellers decided not to list their homes at the same rate as the total cost to buy a home simply went up too fast last year. This shouldn’t shock people when you have the biggest affordability hit in your lifetime in a year; this crushes demand. A seller is a traditional buyer, so when affordability isn’t great, some people don’t list their homes to sell to buy another.
While it has been disappointing to see new listing data trending at all-time lows and low levels of growth in active listings in 2023, we still have more inventory this year than last year. Unfortunately, that’s not saying much.
Purchase application data
Over the last seven months, the big housing story has been purchase application data stabilizing from its waterfall dive in demand in 2022. Starting on Nov. 9, mortgage rates fell from 7.37% to 5.99%, facilitating 12 weeks of positive trending data on the weekly reports, giving us a big jump in sales in the existing home sales reports a few months ago.
Purchase application data look forward 30-90 days, so while sales were still falling, that data was setting the groundwork for a big rebound in demand.
As you can see in the chart below, existing home sales collapsed in the fastest fashion ever in 2022 but then had one big bounce in sales. After that, not much is happening, and for now, I am not looking for sales to get higher than 4.55 million as purchase application data in 2023 has been having a tug-of-war battle between positive and negative prints depending on where mortgage rates are for the week.
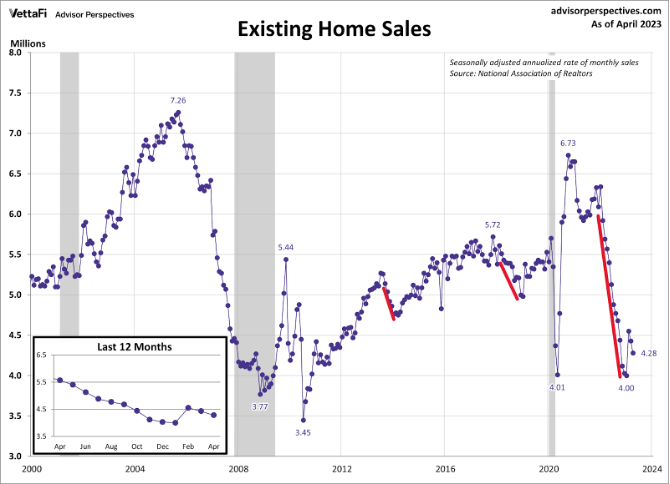
Purchase application data is very seasonal; I typically weigh this after the second week of January to the first week of May since after May total volumes fall. As you can see in the chart below, we are working from a shallow level today, and May is almost over.
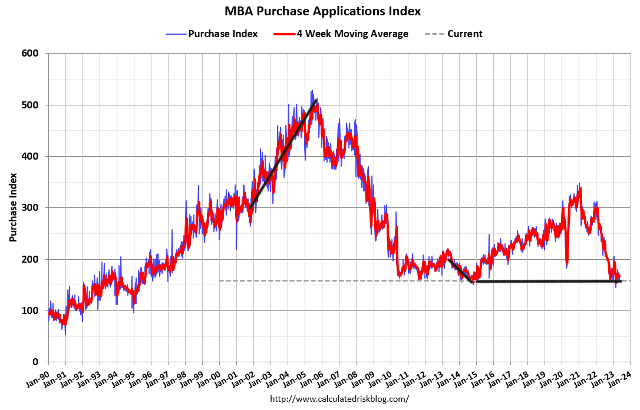
We track weekly purchase application data regardless of seasonality, as the last three years have shown we have seen late-in-the-year runs with this data. In a recent podcast with Mike Simonsen, I talked about why I believe we get the seasonal bottom in inventory later in the year. Now that the seasonality period is ending and considering how high mortgage rates are today, the housing market has had a slightly positive year, something I talked about on CNBC recently.
The week ahead: Bonds and jobs
On this short holiday week, I will first be focused on the bond market reaction to this debt ceiling deal. The housing market moves with the 10-year yield, so watching this is critical.
Second, it’s jobs week again! We will get data on job openings, jobless claims, the ADP report, and the big BLS jobs Friday report. Remember, with the jobs data, wage growth is critical. The Federal Reserve wants a higher unemployment rate, and it won’t tolerate Americans making more money, so from their perspective wage growth has to slow down as soon as possible.
Also we have home price data from the S&P CoreLogic Case-Shiller Home price index and FHFA this week.
The week ahead is all about the bond market reaction to the debt ceiling agreement, watching to see if the spreads improve for mortgage rates and jobs data. Hopefully, the weekly tracker articles have shown how essential it is to track housing data weekly. Too often, people don’t understand the turns in the market, both positive and negative, because they are forced to rely on stale monthly data.