
Thanks to Mike for pointing out that comparing 2022 data to last year isn’t really fair:
The pandemic years, especially 2021, were a strange aberration where everyone moved, house prices skyrocketed, and nearly every real estate business posted record revenues.
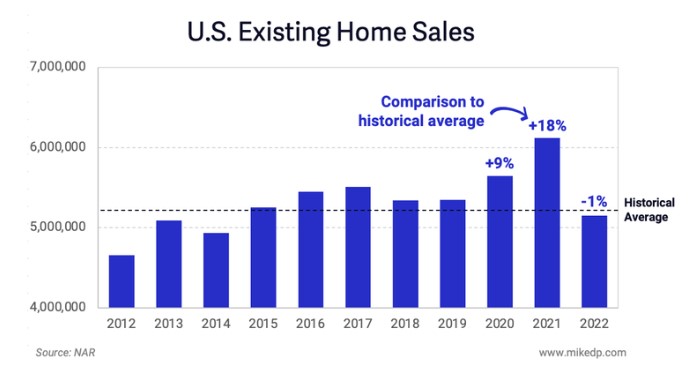
Why it matters: 2022 is constantly being compared to 2021, which was anything but normal, and year-over-year comparisons are painting a deeply negative picture.
Dig deeper: Assuming a fairly conservative 5.15 million existing home sales in 2022, the comparison to last year is a sobering 16 percent drop — but 2021 is an outlier, not a benchmark. Compared to the historical average of the previous eight years (2012–2019), transaction volumes in 2022 would be down only 0.9 percent.
His article:
https://www.mikedp.com/articles/2022/10/11/2021-is-an-outlier-not-a-benchmark
~~~~~~~~~~~~~~~~~~~~~~~~~~~~~~~~~~~~~~~~~~~~~~~~~~~~~~~~~~~~~~~~~~~
How are we doing around here?
NSDCC Detached-Home Sales Between January-September
| Year | ||||
| 2017 | ||||
| 2018 | ||||
| 2019 | ||||
| 2020 | ||||
| 2021 | ||||
| 2022 |
Sales caught up quickly after the initial Covid swoon, so the 9-month count in 2020 looks fairly normal. The average for the first four years is 2,229 sales, and last year’s count was 14% higher.
This year’s count looks dire at -38% YoY, but the -29% below normal doesn’t look that great either. The pundits would say it’s a result of unaffordability, and yes, homes are much less affordable after the median sales price rises $520,000 in one year.
Sales are down because sellers are holding out on price – if they had to sell, they could.


How can the Padres afford their high-priced players? They have other things in the works!
A city-owned asset since the formation of downtown’s ballpark district, Tailgate Park is bounded by 12th and Imperial avenues, and K and 14th streets. It is leased to the Padres through the end of 2043 for use as a parking lot and special event space. The site is governed by a complex set of state regulations because the parcels were owned by San Diego’s now-defunct redevelopment agency, Centre City Development Corporation. The city took over the land after redevelopment agencies were dissolved by the state, and earmarked the site for future development.
In September 2020, San Diego selected the Padres development team to redevelop the property following a competitive bidding process. In April, following a 14-month negotiation period, city leaders approved the sale alongside a 189-page disposition and development agreement that defines what’s allowed on the 5.25-acre site.
The buyers have agreed to build a $1.5 billion project called East Village Quarter. It includes 1,800 residential units, 50,000 square feet of retail and office space, a 1.3-acre public park and a 1,200-space parking garage.
The developers must also reserve no fewer than 270 residential units for low- and middle-income families. Per the contract, 10 percent of total units, or 180 units, will be affordable, or deed-restricted for households earning up to 60 percent of the area median income. Another 90 units will be reserved for households earning up to 150 percent of the area median income.
The affordable and middle-income covenants have been characterized by critics, including Moreno, as insufficient in light of California’s recently amended Surplus Land Act. The state law, which governs how local agencies handle excess property, was amended in 2019 to push municipalities to make affordable housing a priority when they sell or lease land they no longer need.
However, as a redevelopment asset, Tailgate Park receives special treatment. Specifically, the property is not subject to the law’s requirement that at least 25 percent of proposed housing units are set aside for low-income families — so long as the negotiated transaction closes before the end of the year.
But a legal challenge has prolonged the matter indefinitely.
Earlier this year, Project for Open Government sued the city and the development team, alleging that the approved transaction violates several city and state laws. The suit has put on hold forward progress of the transaction and construction of the East Village Quarter project, as the developers won’t be able to secure financing until the case is resolved.
“Tailgate Park was negotiated in good faith with the city of San Diego and in accordance with all applicable local and state laws,” said Bud Perrone, who is a spokesperson for Tailgate Development, LLC. “This important project will benefit the entire community through the creation of desperately needed housing, hundreds of good-paying jobs and a vibrant public park. We look forward to completing our agreement with the city and starting construction as soon as possible.”
The transaction is not yet at risk of being aborted, thanks in part to the council’s action to remove the Dec. 23 deadline from the development agreement. The extension is consistent with the Surplus Land Act, which grants additional closing time for redevelopment site deals that are being challenged in court.
“Under the Surplus Land Act, an extension of the date of disposition shall be extended if the city’s right or ability to dispose of the property is the subject of a judicial challenge to a date that is six months following conclusion of the litigation,” Christina Bibler, the city’s director of economic development, told council members.
Council members were also asked Tuesday to revise language in a previously adopted resolution that could have created legal ambiguity. The resolution mistakenly referenced fair market value instead of fair reuse value. While similar, the terms are not the same.
The Tailgate Park property was appraised at $76 million, but its fair market value was set at $34 million. The reduction reflects the cost to pay for replacement parking, as the city is required to do per the terms of its lease with the Padres. The land’s fair reuse value — or the highest price the site could fetch in a competitive open market — is $35.1 million, as determined in a separate analysis prepared by real estate economics advisory firm, Keyser Marston Associates, Inc.
“The term fair reuse value is consistent with staff’s recommendations in the staff report, which council voted to adopt, as well as in the (Keyser Marston) report that stated consideration for the sale of the property would not be less than fair reuse value,” Bibler said.
The Project for Open Government lawsuit was filed in San Diego Superior Court on May 18 and has been assigned to Judge Katherine Bacal. The case could be considered by the court in early 2023, the developer said.