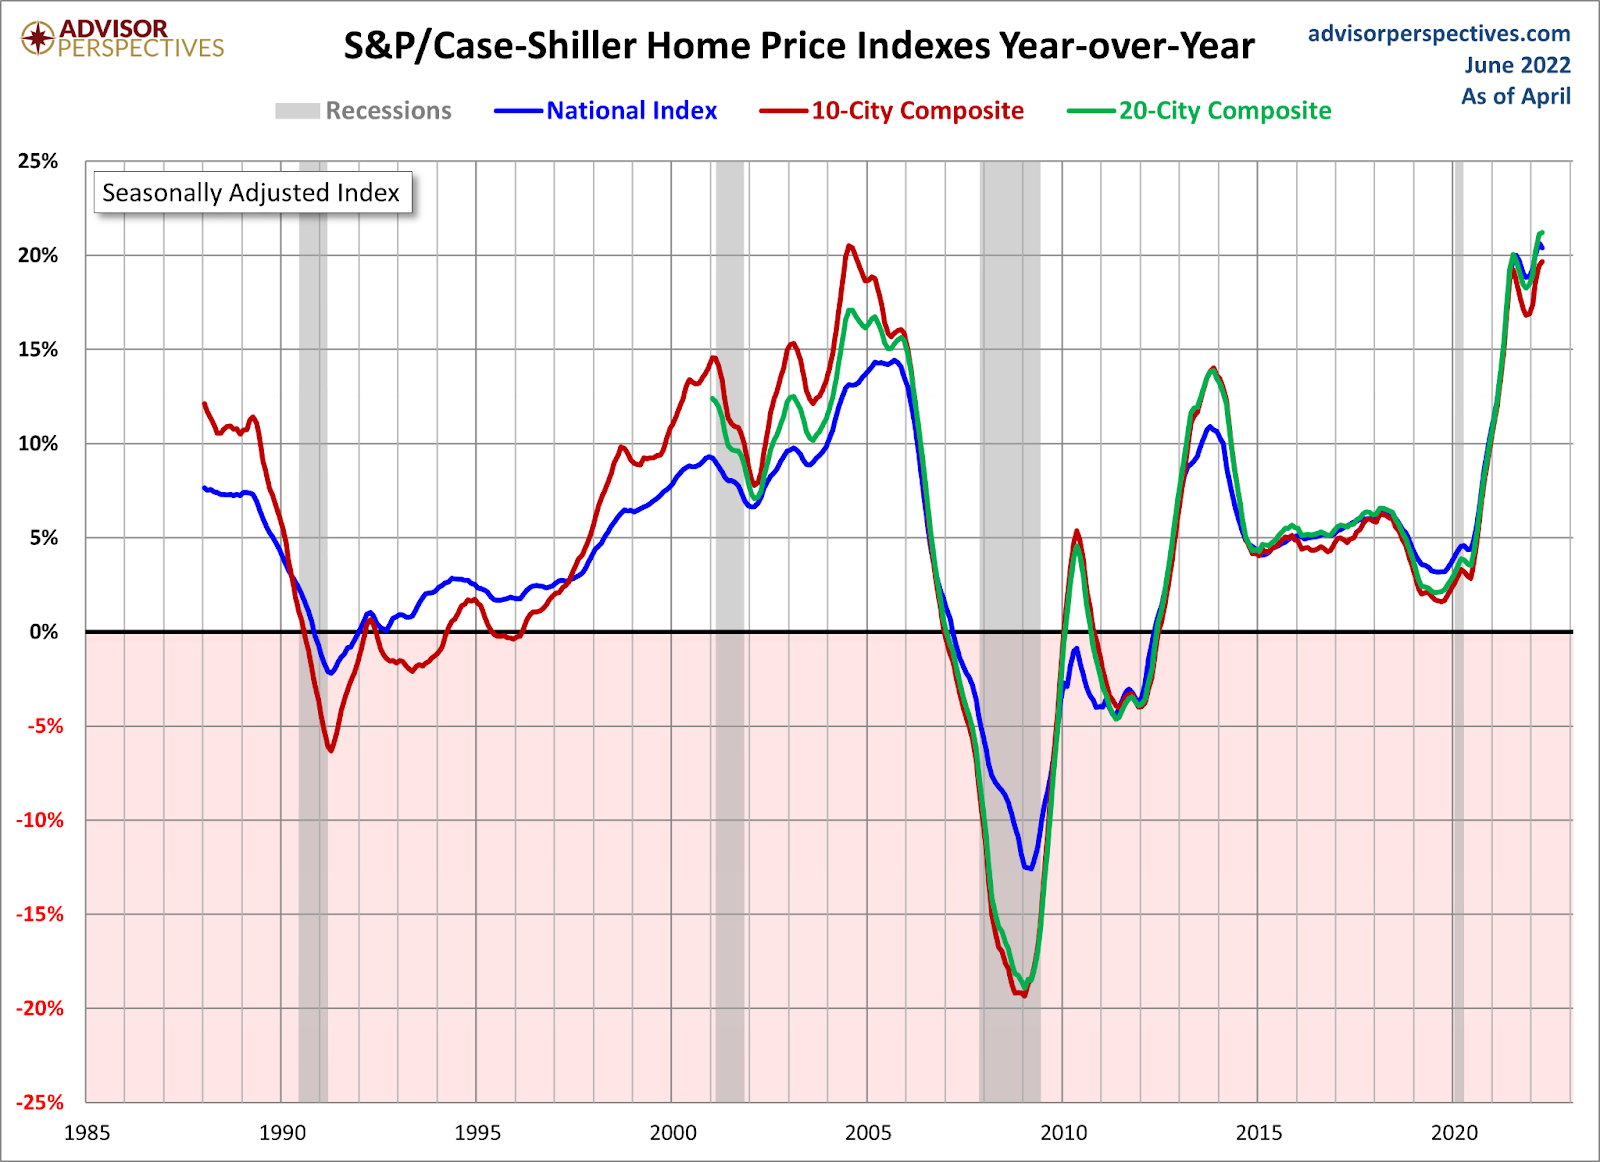
The S&P CoreLogic Case-Shiller Home Price Index just recorded 20.4% year-over-year growth nationally and a record 21.2% growth for its top 20 city composite, and now you know why my most significant concern for housing was home prices overheating, not crashing like people have warned about from 2012-2021.
From S&P: The S&P CoreLogic Case-Shiller U.S. National Home Price NSA Index, covering all nine U.S. census divisions, reported a 20.4% annual gain in April, down from 20.6% in the previous month. The 10-City Composite annual increase came in at 19.7%, up from 19.5% in the previous month. The 20-City Composite posted a 21.2% year-over-year gain, up from 21.1% in the previous month… Nine of the 20 cities reported higher price increases in the year ending April 2022 versus the year ending March 2022.
This data line lags the current housing market as it’s a few months old. Since the summer of 2020, I have talked about how to cool down home sales: we need the 10-year yield to break over 1.94%. This happened in March, and thankfully so. Imagine if mortgage rates didn’t rise this year. We are still showing double-digit home-price growth trends in the recent data as it takes time for higher mortgage rates to really increase supply back to normal levels.
However, as you can see below, the damage has been done with home-price growth. I developed a specific home-price growth model for the years 2020-2024 which said that if home-price growth grew at 23% for five years we would be fine, with total housing demand —both new and existing homes together — getting to 6.2 million or higher.
Well, guess what? America did a Hulk Smash on my model in just two years. Whenever you see vertical home-price growth over a period of time, it’s never a good thing. This either means you had a massive supply shortage or you had a credit boom.
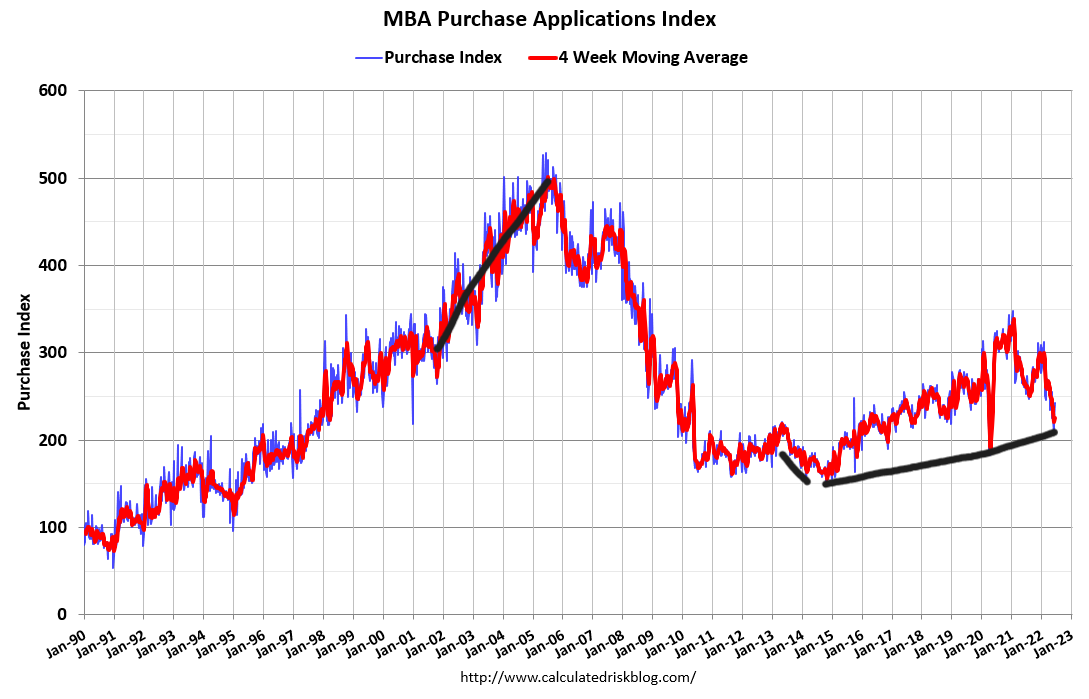
Since 2014, we’ve not seen the credit housing boom that we saw from 2002-2005. Even today, the MBA purchase application index is below 2008 levels. The housing market can’t replicate the type of massive credit expansion we saw from 2002-2005, so the price-growth story has more to do with inventory collapsing to all-time lows.
It’s not just home price inflation either; shelter rental inflation has also taken off. When supply is low and demographics equal demand, don’t make it complicated, folks. People always need somewhere to live. If they’re employed, they’re either buying a home or renting.

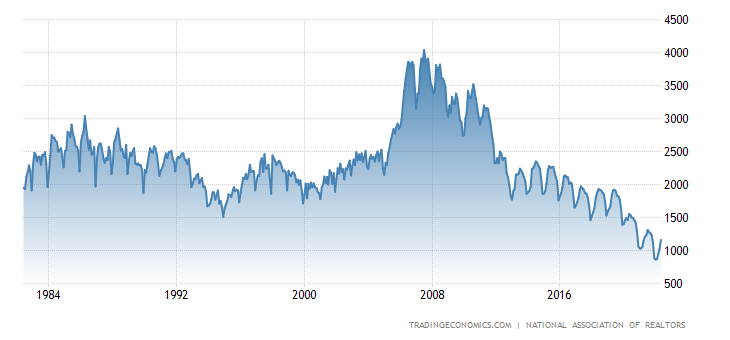
Still, we can see the damage being done in the past few years as total housing inventory collapsed to all-time lows, and we are working our way back to just the historically low levels of inventory of 1.52 – 1.93 million.
For some time now, I have been focusing on that 1.52-1.93 million total housing inventory data as that is the level of inventory that would change my thesis that this is a savagely unhealthy market. The reality is that inventory collapsed to all-time lows right when our most prominent demographic reached their peak home-buying age. I believe once we get between 1.52-1.93 million, the housing market can be sane again, even though those levels were the historically low levels of inventory going back to 1982. I present my case for how we can break into that range next year on a podcast with Altos Research.
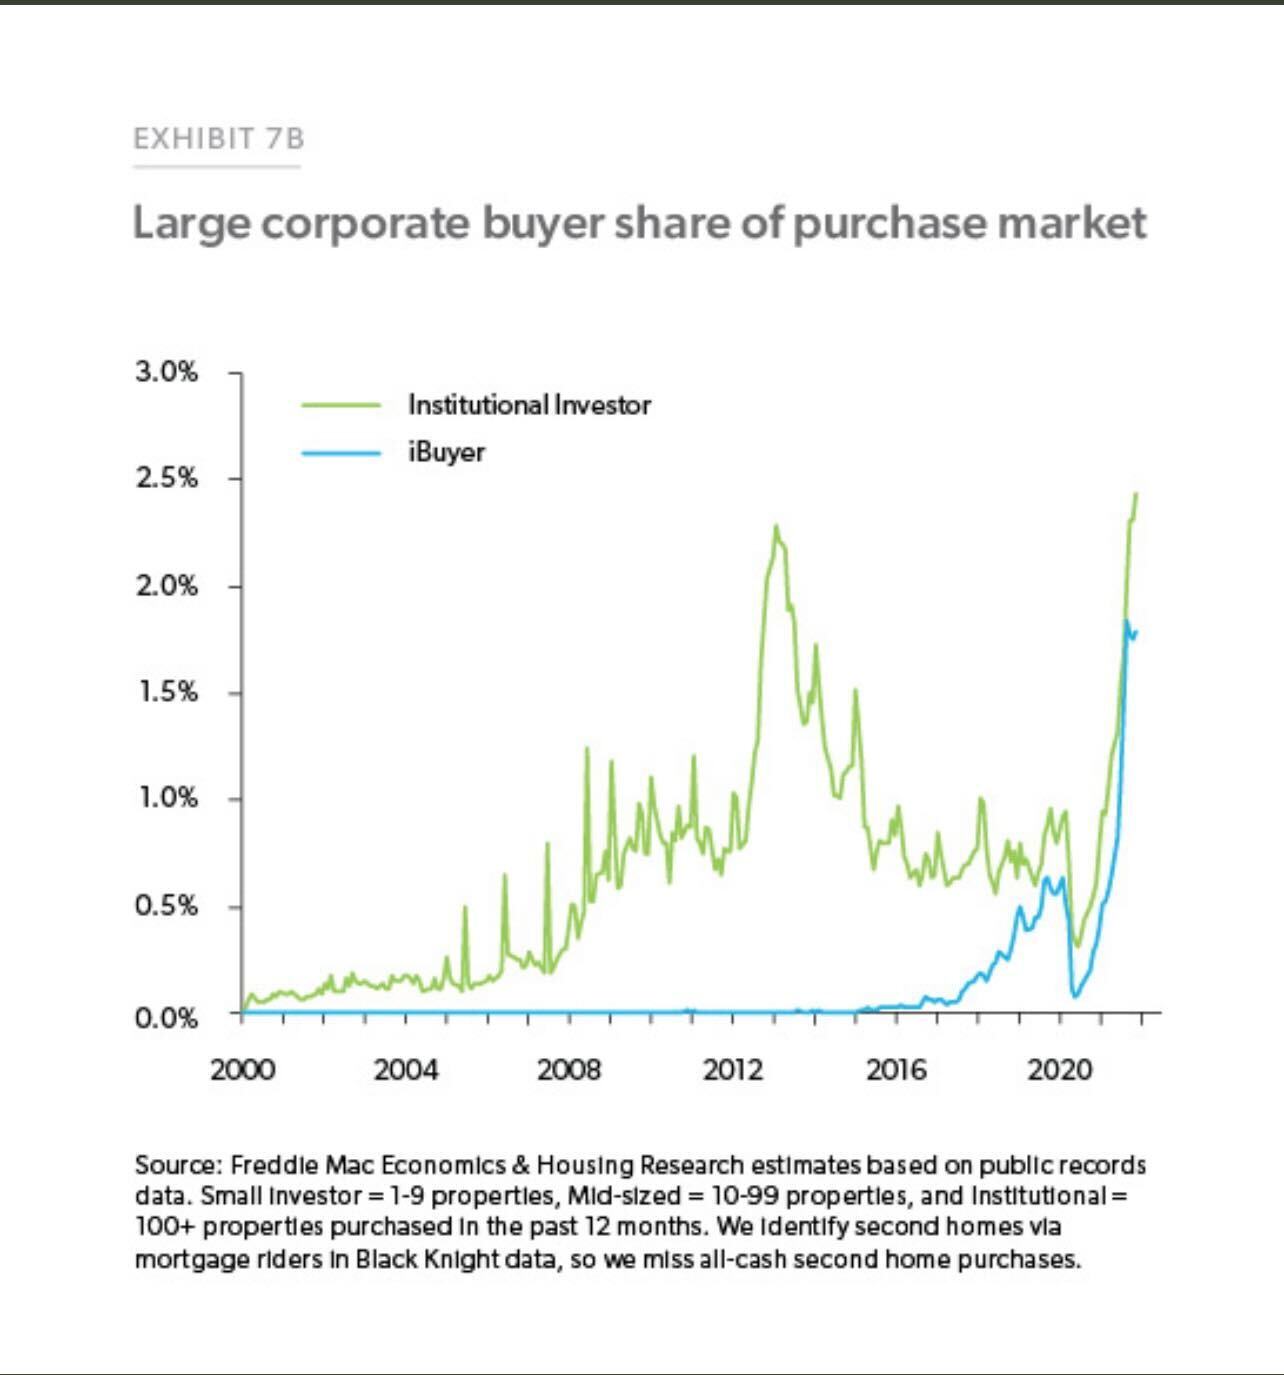
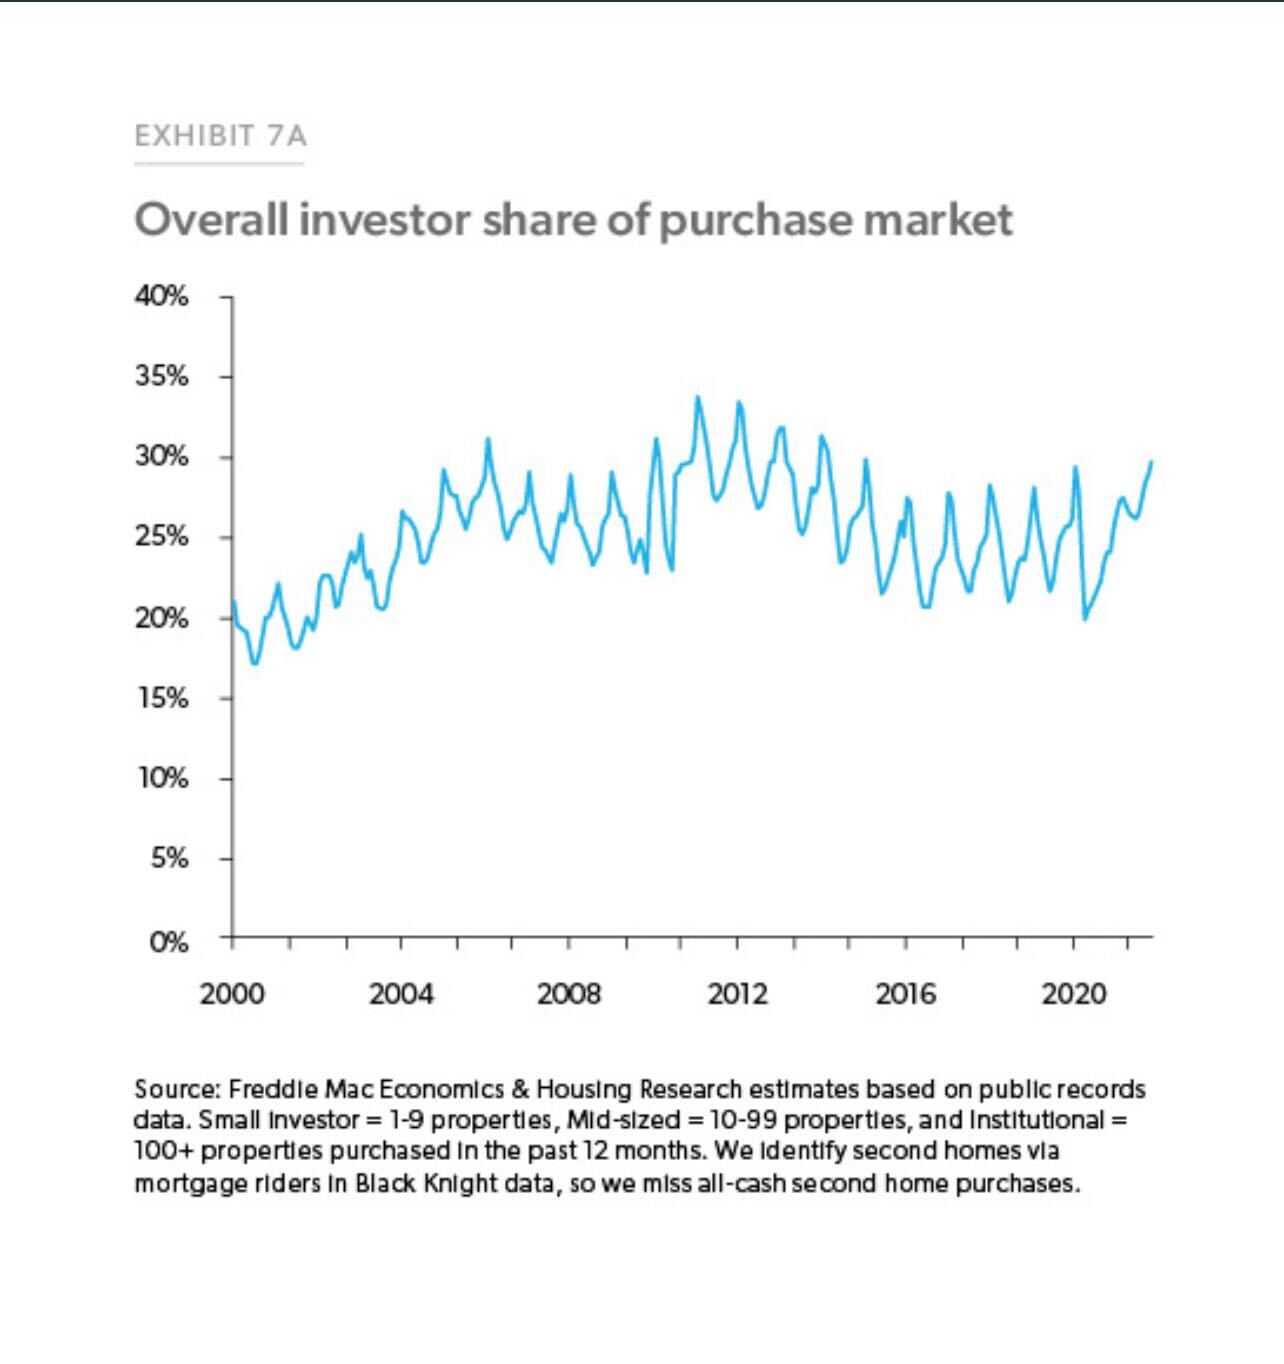
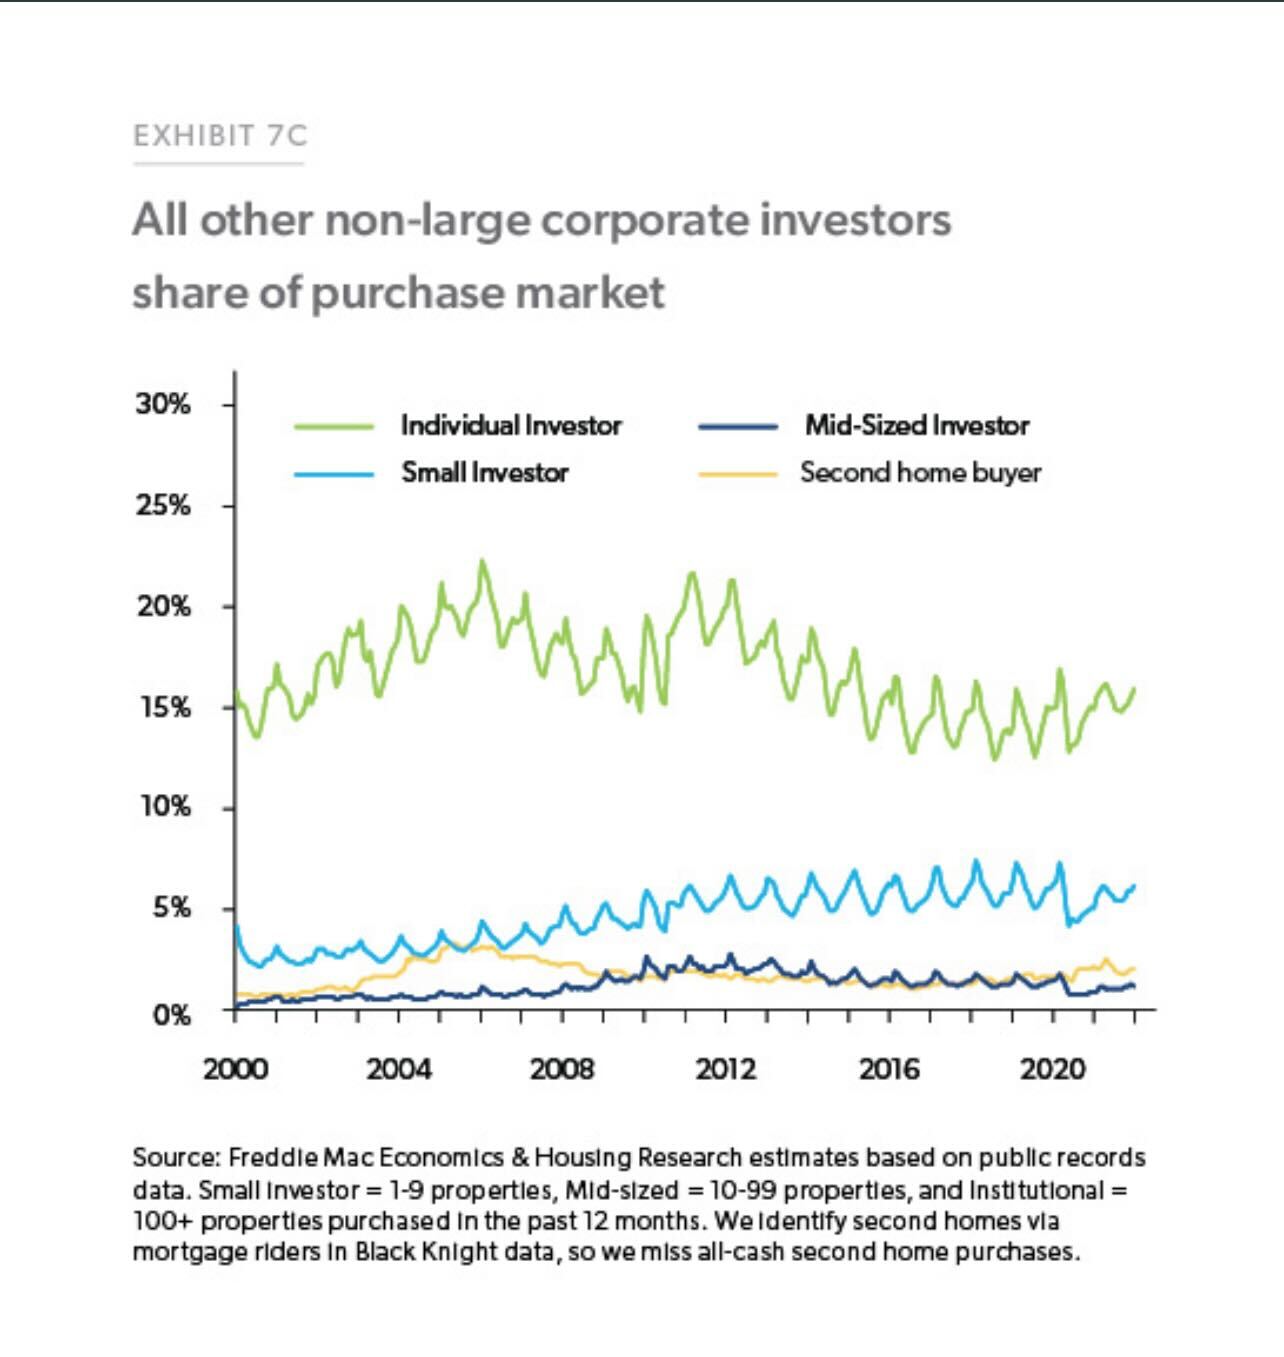
Hopefully, you can understand why we needed higher rates last year and early this year to try to cool the price-growth market. The reality is that home sellers and builders had too much pricing power. Also, certain investors felt no fear post-2020. The percentage of home flipping has grown since 2020, even beyond the housing bubble years, and we see some growth in total investor demand, however, as seen below, Institutional investors are still a small percentage of homebuyers.
From Freddie Mac:
In general, investors are mostly mom-and-pop investors, and a lot of them are looking for rental yield, and everyone needs shelter.
When it comes to the years 2020-2024, don’t think of a housing boom in sales or credit. Think replacement buyers, the biggest youngest demographic patch in history, move-up, move-down, cash and investor buyers together — this is driving great replacement buyer demand during this period.
That demand, while it didn’t look like anything we saw at the peak of 2005, was good enough to facilitate historical home-price growth during these years. The only thing that can cool this down is higher mortgage rates, which has started already.
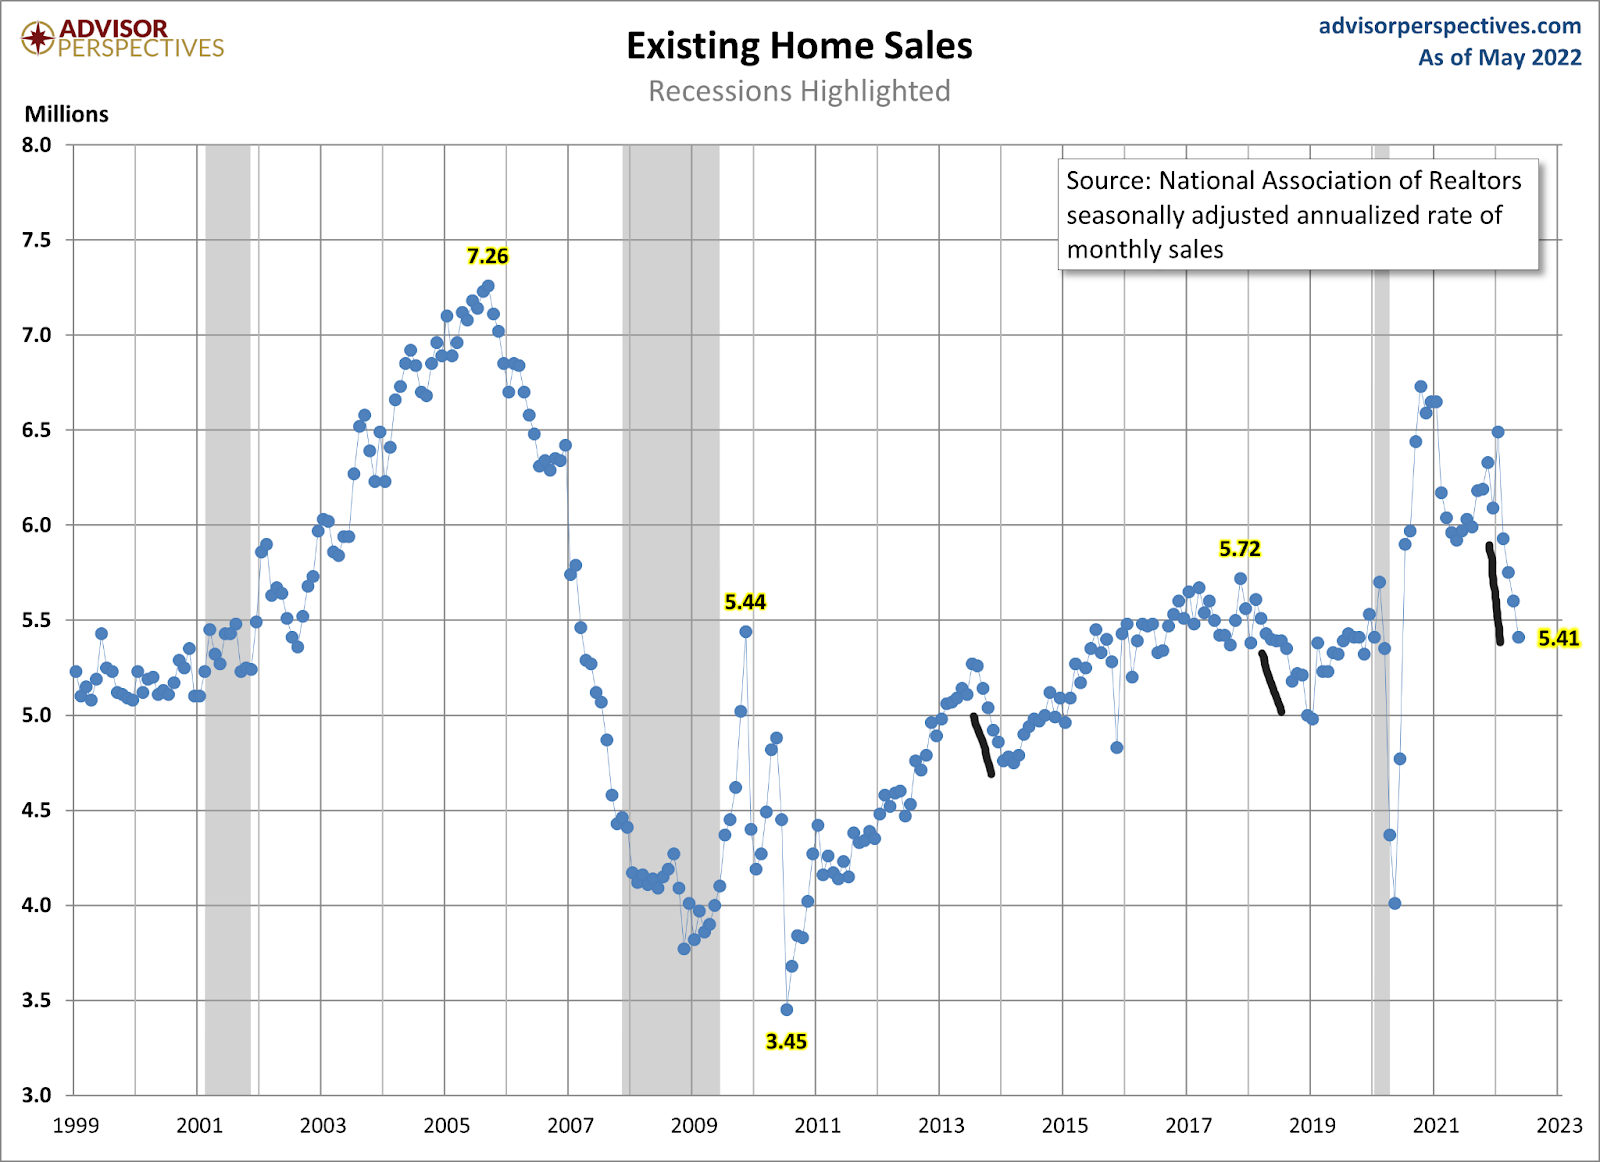
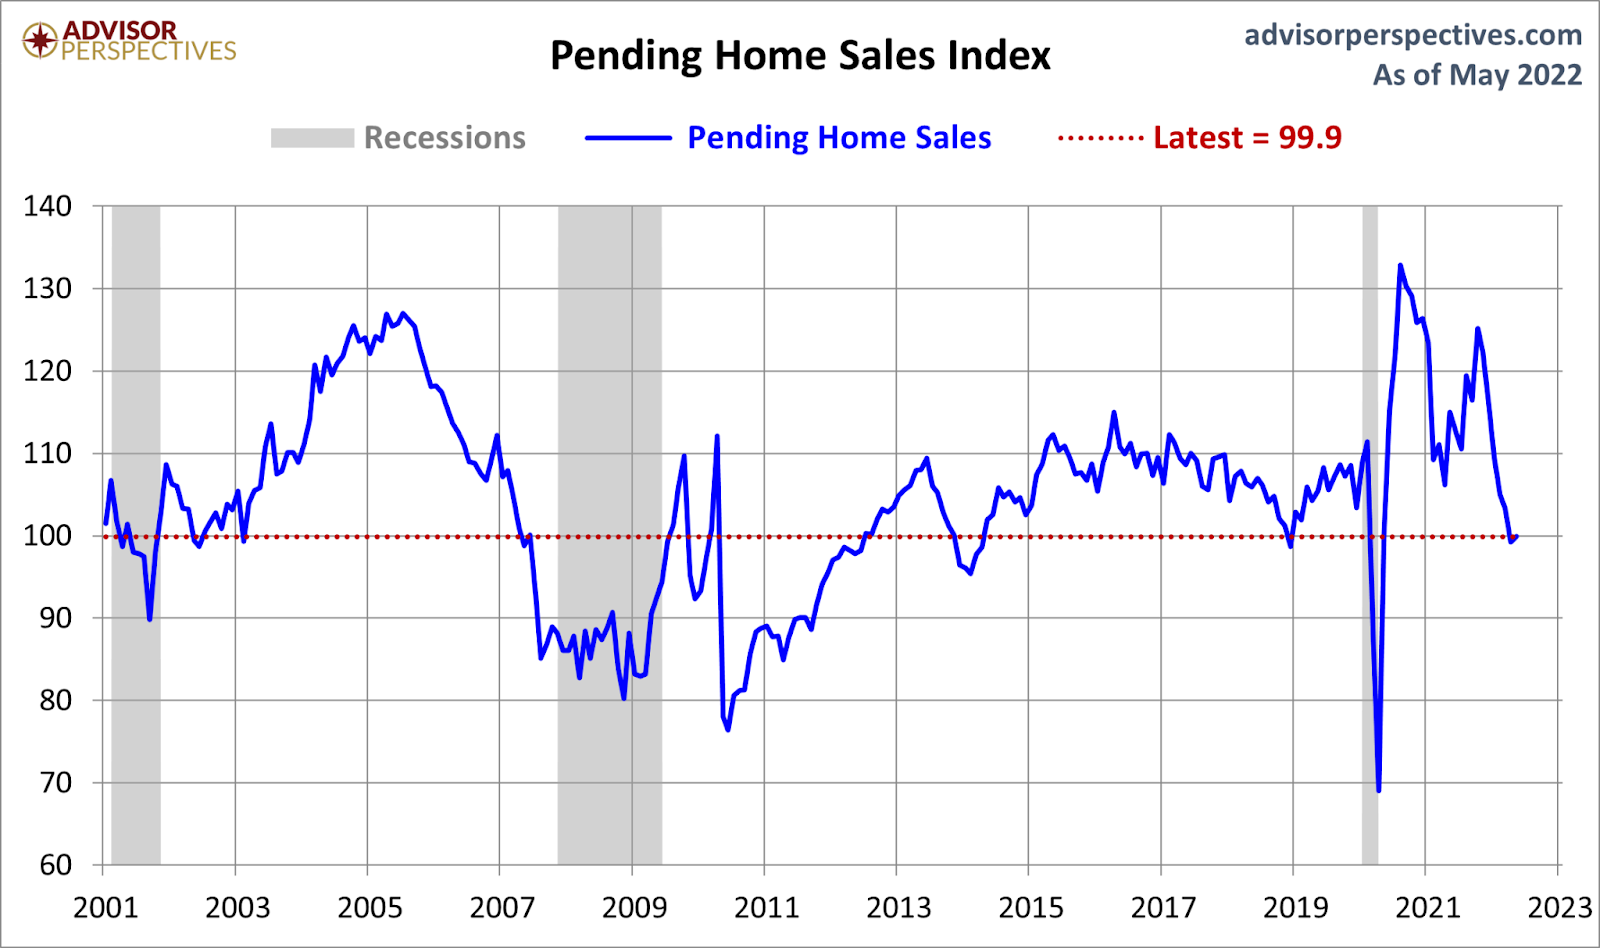
Even though pending home sales did come in positive yesterday as a beat of estimates, we can see the downtrend in sales as rates rose. This is because the biggest buyers of homes are mortgage buyers. They run the show, not Wall Street investors or iBuyers — those players are just too small.
To sum it up, this is not how I wanted 2020-2024 to turn out. While people were talking about housing bubble 2.0 from 2012-2019, I knew the demographic muscle patch would come in 2020-2024. Nobody can say I didn’t warn my housing bubble boy crew about this in 2019, With that said — and with just a special hello to my forbearance crash bros — I see what happened to housing because of prices as a negative, not a positive. If home-price growth grew at 3%-4% a year, we would have had clear sailing for years without too much damage when rates rise. That, of course, wasn’t the case, and we paid the price, having housing inventory break to all-time lows in 2020-2024.
Now, the focus is on the future of the housing market, and for myself, it’s all about the B&B market: boring and balanced. To have that market, we need total inventory data to get back to 1.52-1.93 million with at least four months plus of monthly supply. Then I can stop calling this a savagely unhealthy housing market.


Logan, Very insightful, as was your luncheon presentation Tuesday at Gathering of Eagles. Six months of inventory has long been considered a balanced market but so much has changed. Would you consider four months of monthly supply the new definition of a balanced market?
Hi Kevin, I’m glad you enjoyed the nerd zone chat at the event. For me, Once total inventory can get back to 1.52-1.93 million which means we touch that 1.93 million level and four months + of supply, I consider that balance on a national basis. Local markets will vary with the monthly supply data, of course. Historically speaking, 2 – 2.5 million is the norm; for total housing units avaabile and post 1996, it’s scarce to get six months of supply nationally, outside the forced credit selling period of 2006-2011.
Thanks for the insight Logan! Sounds like four months is the new six months when it comes to housing inventory and a balanced market
(-: