
Get out your tinfoil hat, folks, and place it firmly on your head!
Close the curtains because the neighbours are all spies.
Let’s talk about who killed JFK, who’s responsible for 9/11, and who put the caramel in the Caramilk bar.
And while we’re at it, let me regale you with a little conspiracy theory I’ve got running…
The monthly release of “TRREB Market Watch” isn’t quite as celebrated in Realtor-circles as, say, Christmas in your household, but for many of us, it comes close. We never know exaclty when the stats will be released, but it’s usually around the 4th, 5th, or 6th of the month.
And it has to be, right? To publish a statistical analysis of last month, you’d need a day or two after the month has concluded. But more importantly, you’d want to leave a few days for the late-comers to report their sales. Just because something sells on August 31st doesn’t mean that the listing brokerage is going to update MLS that very day. It can take a day, or two, or three, or more for those lesser-than brokerages to get current. And what of conditional sales from August that firm up a few days into September?
On average, I’d say that the TRREB Market Watch is released around the 5th of the month.
This year, with the 3rd and 4th falling on Saturday and Sunday respectively, and the 5th being Labour Day, I figured we’d see the TRREB stats on Tuesday, September 6th. Maybe even Wednesday, September 7th, if things are really busy over there.
But what day did I absolutely not expect the stats to be released?
September 1st
It makes absolutely no sense to me, and as long as I’ve been tracking and writing about TRREB stats, which is probably fifteen years, I have never seen the stats released on the first of the month.
Forget about the statistical inconsistencies, the incomplete data, and the unreported sales, just for a moment, and ask yourselves: why?
Why did TRREB absolutely rush to get these stats out, in a way that they’ve seemingly never released stats before?
There are two reasons, in my mind, and one is positive and one is negative:
1) TRREB saw that sales were up almost 15% from July to August and therefore rushed to get the news out!
2) TRREB wanted to get the news out before the long weekend so it was buried in a busy news cycle and therefore not talked about the following week.
Is your cup half-empty, or half-full?
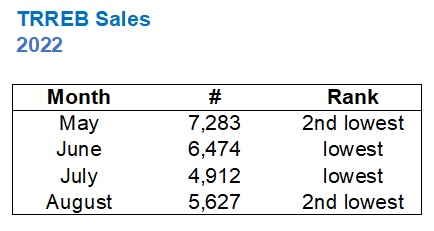
I suppose we’d have to dig through the data first to see if these stats are good or bad. That’s open to interpretation, of course, and I could honestly make an argument either way. At first, I thought that the improved sales figures were something that TRREB wanted to rush to the news cycle, but then when I re-ran the sales from August 1st – August 31st through MLS and found almost 5,900 sales, compared to the 5,627 that TRREB reported, it made me wonder, “Why wouldn’t they wait for better news?”
So maybe they did want this buried in the pre-weekend news cycle?
Who could say!
So let me provide my take and perhaps we can then debate whether the August figures point to a healthier market that’s on the rebound, a slow market on the decline, or a balanced market that shows little sign of turning one way or the other.
First and foremost: average home price increased last month.
Yes, it’s true. For the first time since February, we saw the average home price in the GTA increase on a month-over-month basis.
A modest 0.4%, which is essentially a rounding error, but considering the declines in the preceding months, this is quite significant.
Here’s the average home price in the GTA each month this year and the corresponding increase/decrease:
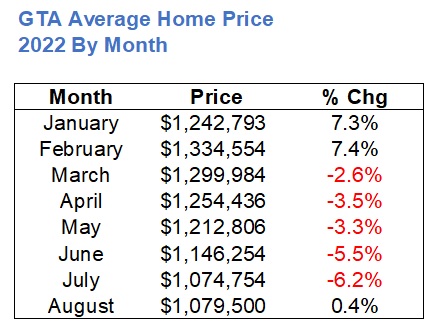
For those of you who frequent this blog, you probably feel like you know these numbers off by heart. I certainly feel that way.
And for those that figured we were in a downward spiral, or at least a downtrend, I would ask this: does the increase in August change your mind?
The bears will argue that a 0.4% increase is barely an increase, so there’s no reason to think the September figures won’t drop further.
The bulls will argue that to see 5.5% and 6.2% drops followed by an increase, any increase, is a sign that the market has bottomed out.
I would ask this: what normally happens from July to August?
You know how I think! If we see an increase every year, then this is less important.
Here’s all the data from 2002 onward:
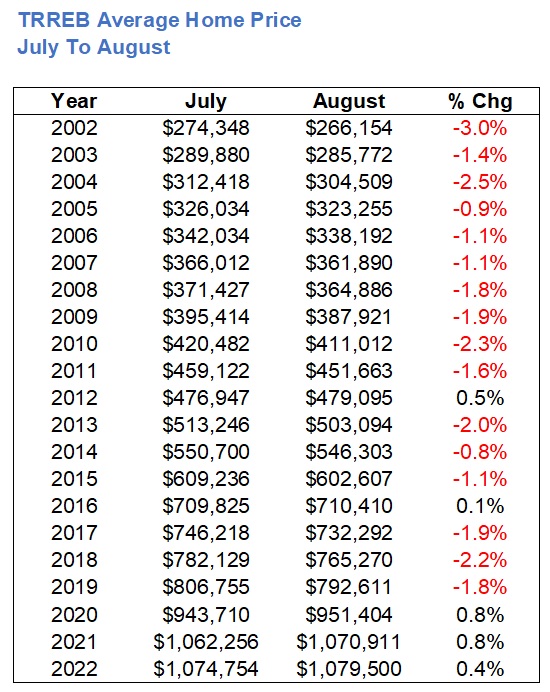
So in 16 of 21 years, the average home price decreases from July to August.
But in the two years prior to this past month, we saw the figure increase.
You might be tempted to go with the recency bias, but considering the insane downward pressure on prices – a 5.5% drop in June and a 6.2% drop in July, this 0.4% increase is of tremendous significance in my honest opinion.
I also mentioned that sales were up, month-over-month, from July, which is also significant considering they’ve declined every month since March.
That’s five months of decline in prices, and four months of decline in sales, for those playing along.
So is a 14.6% increase in sales, month-over-month, anything to celebrate?
Maybe. It’s a definite maybe.
As I noted above, I’d want to see what sales “usually” do on a month-over-month basis, July to August, in order to gage the market.
So let’s have that, please:
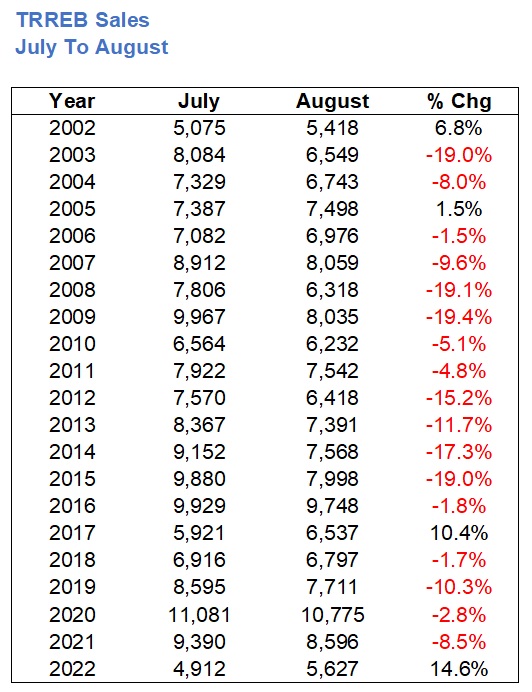
Here we can see that in twenty previous years, only four times have sales increased from July to August.
And the increase last month was substantial at 14.6%.
Accuse me of trying to make an argument here, if you want to. I assure you that’s not my intent.
If we look at the year-over-year sales figures, January through August, we can also see a trend:
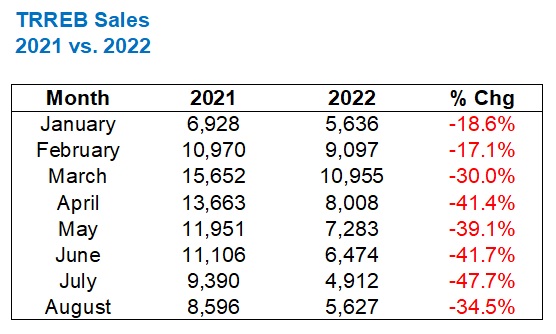
Sales have been down, across the board, from what was an absolute record year in 2021.
But when the market began to slow in March, we saw the decline increase to 30%, year-over-year, then hang out ‘around’ 40% in April, May, and June, before showing us a dastardly 47.7% decline in July.
So while sales were down in August by 34.5%, year-over-year, the trend seems to be reversing.
Then again, if you want some evidence to the contrary, consider that when I wrote my “May Stats” blog, I showed you that the 7,283 sales in May were the lowest ever, save for 2020 when sales were crushed due to the pandemic. Then June and July saw the lowest ever, period.
So what of August?
It’s hard to see that trend and claim the market is turning around, right?
Look, I go where the stats take me. You can make numbers say anything you want and all that, but I’m genuinely looking at these figures trying to spot trends.
Can you tell me you see something different?
Take the sales-to-new-listings ratio as a metric as well.
As sales slow, new listings remain the same or slow at a lower rate, and inventory builds, we see the market shift into “buyers” territory.
An SNLR less than 50% is uncommon in Toronto and points toward a slowing market.
An SNLR below 40% is absolutely unheard of.
And yet, in May, we saw an SNLR of 39%, which was 7,283 sales up against a whopping 18,679 new listings.
So how does the SNLR in August look?
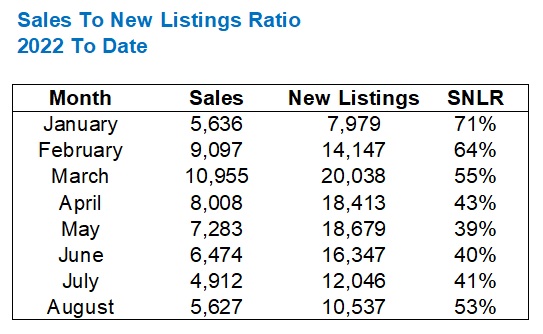
Well, it looks like yet another reversal of a trend.
39%, 40%, 41%
That’s May, June, and July, and definitely felt like we were heading into buyers’ market territory.
But with a 53% SNLR in August, and with a busy September ahead, I have to wonder if the tide is turning.
One of three things is happening:
1) We’ve hit market bottom, the tide has turned, and the August stats show a rebounding market.
2) We are in the midst of a medium-term downtrend and August is an outlier.
3) August is a classic “dead cat bounce” that provides further evidence that the market is going to decline in the fall.
The timing of a 0.75% interest hike yesterday is going to help arguments #2 and #3.
But how do you ignore the preceding data?
Also, listings have been slow so far.
This is my MLS home page as of Wednesday night:

When the market is in “peak” season, I’m used to seeing 120 new listings downtown, not 53.
I’m used to seeing 30 new listings in C9/10/11, not 15.
And the east side? Only 11? That’s typically 35-40.
If listings are slower than anticipated this fall, and sales are simply in line with expectations, this won’t be a buyer’s market.
But that’s just my opinion.
I’m happy to hear yours…


Appraiser
at 7:01 am
Since I already called the bottom last week, my opinion is known. Interest rate hikes are less of a shock to the market than when they first started and have become somewhat baked-in.
Also important to reiterate that the demand for housing has not been diminished, but rather the burden of higher prices has shifted to the rental market.
J G
at 11:34 am
Willing to bet the house 12 months from now, average price for GTA will be lower than today (Aug 2022 stats).
Appraiser
at 2:36 pm
Unstoppable.
Bal
at 10:20 am
how people are even able to afford mortgage payments? if mortgage payments are still rising….it cannot be bottom yet…i think once BOC will stop raising rates…then story will be different i guess…it is too early to call bottom…
Condodweller
at 1:30 pm
We’ll have to watch the FED/BOC press releases for wording to see at what point they might slow the rate of increase, never mind stop it. Even once they stop when would they even think of lowering? So far the party line is they are aggressively raising to fight inflation no matter what. They have had a hard time convincing people/markets that they are raising rates. I wouldn’t expect any signs of easing until at least next year.
ash
at 9:43 am
CPI ain’t under control. Based on US data, it appears more rate pain is on the horizon. Trigger fingers and rates at the ready. This will significantly get worse before it gets better, this downturn is just getting started. It is funny to hear the end is around the corner. The chance of a 75bps increase in October has now went up by 50% and the possibility of a December increase just showed up
Marina
at 11:58 am
Wouldn’t surprise me if prices went up again briefly, by a little bit. Fall market is usually pretty wild, and given how dead summer was I wouldn’t be surprised if we see a little revival.
But if we do drop into a recession and interest rates keep going up, prices will fall further.
That said, I’m curious how things are breaking down by part of TO. Is Durham also bouncing back, or is it mostly the 416 area? I think with return to office, a steady 416 price is not surprising. I would be very surprised though if the suburb momentum rebounds.
Appraiser
at 6:22 am
Interesting contrast:
“Surveys suggest that short-term inflation expectations remain high. ” ~ Bank of Canada
https://www.bankofcanada.ca/2022/09/fad-press-release-2022-09-07/
“U.S. consumers’ inflation expectations fall again, NY Fed says” https://www.reuters.com/markets/us/us-consumer-inflation-expectations-ease-again-ny-fed-says-2022-09-12/
Kyle
at 11:31 am
People do not liquidate their homes, unless they have no other possible choice. So unless there is a deep recession that causes large job losses, prices will not be going down much more, if any. You can see from Mortgage arrear rates (which is at 0.06% in Ontario) that despite interest rates increasing, people are still able to afford to hold on to their homes.
In fact i would agree with Appraiser that we’ve likely bottomed already. Homeowners who had to sell (i.e. purchased another property, called back in to the office, life circumstances) have already sold. Remaining homeowners will just wait for the market to recover before even contemplating selling.
Many who tried to sell and didn’t get the prices they wanted have decided to wait it out or to rent out their properties instead. I think we’re going to see MOI come back down very quickly. Buyers who are on the sidelines will be jumping back in once they realize prices aren’t going any lower.
Jimbo
at 1:44 pm
Interest rates don’t really wipe out someone’s share of the market equity they have earned. So, sure maybe my market equity took an $xx,xxx hit, but so did every other home homeowner.
What the market does won’t kill Toronto. The majority will be able to trade when they please and they can do so when rates look like they are peaking. At that point variable will win the day again.
The one thing I really misjudged when I started looking at Toronto in 2012 was the account of equity the majority had.
Will it be easier to enter the market? I think the only metric that had changed in that regard is the down payment required to buy. The monthly payment will match the last 3-5 years at the end of the day. However, not so much for those that bought for the first time in the last two years. They will feel the pain
Condodweller
at 1:53 pm
Oh, the good old days when a downpayment was about three months’ pay.
Jimbo
at 11:13 pm
I don’t think you were getting a home with 3 months pay as down payment in 2015. I think if you bought in 2019 and before you probably fit what I’m describing above.
The average new mortgage that was taken out in 2021 in Toronto was around $500k. As per CMHC report. I don’t think the current rates are incredibly painful on that mortgage amount.
Condodweller
at 9:17 am
No, I bought in the 90s and that was a condo. A home would have been a few months more. I was just confirming what you said about the only thing changing is the downpayment with increased mortgages. Aside from the fact one has to qualify for the higher mortgage.
Average Joe
at 8:42 pm
This completely ignores the high number of investors in the big markets. At the start of the GFC it wasn’t the NINJA loans that unraveled first, it was the levered speculators blowing up that triggered the meltdown.
Jimbo
at 11:08 pm
Anyone carrying 2 or more properties on a HELOC will have some tough decisions to make.
I just don’t know what percentage of the investor market bought into the frenzy of 2020-2022 and how many of those are in Toronto Vs cheaper outlying areas.
Derek
at 12:55 pm
“But how do you ignore the preceding data?”
Is there any data for month to month and year to year percentage changes for an environment of interest rates having increased significantly?
How can we measure or make predictions about what is happening now based on what happened under 20 years of polar opposite monetary policy?
Condodweller
at 1:23 pm
We are in interesting times for sure. Theoretically, home prices are supposed to increase by the rate of inflation over the long term. In theory, higher inflation should bring higher prices now. However, home prices have well outpaced inflation over the past few decades so where does that leave us in terms of average today?
Historically higher rates meant lower prices due to the affordability factor. As prices increased over the past as rates went down, prices should also decrease with increasing rates now all else being equal. Even if people can find the financing, they need the confidence to buy.
I’m curious how people renewing at higher rates will affect the market and will there be a wave of sellers at one point to drive prices down. US CPI came out today and it’s down a bit but let’s see if the trend continues. The key will be at what point does the FED stop increasing rates.
Also, will private money create a house of cards where eventually people won’t be able to get financing anywhere due to high rates? That would surely put a damper on prices.
I would expect a bit higher prices in the fall due to the seasonal strength then ease off again.
My question to bulls is where are people getting the extra money to pay for higher prices going forward as buying power decreases with higher rates?
JL
at 11:09 pm
“My question to bulls is where are people getting the extra money to pay for higher prices going forward as buying power decreases with higher rates?”
I’m with you on this. If it’s all about the monthly payment and not the purchase price, I don’t know how prices go up (over a sustained period) with interest rates (and payments) also going up at the same time.
Ace Goodheart
at 2:58 pm
The market won’t bottom out until the BoC stops raising interest rates, and the bond markets stop tightening.
We just learned that the BoC is on track to lose about $5 billion due to some interesting realities in relation to the buying and selling of securities in a rising rate environment.
That means, quite bluntly, that there will be no white knights riding around the bond markets, snapping up mortgage bonds with low interest rates. If you can get government debt for a premium, you are not going to buy mortgage bonds. So the interest rate required to make a mortgage bond sale-able, is going up.
Banks make money by selling mortgage bonds and then flipping the debt onto consumers for higher rates. So if a bank needs to offer a higher rate on its mortgage bonds, it will charge a higher rate to the consumer who takes out the mortgage.
We are nowhere near the end of this. Unless you can find someone with cash (harder and harder to do these days, everyone has two things – property and debt) you are finding someone with the ability to borrow money and buy your house. And that ability just keeps getting more and more restricted.
Mortgage interest rates are set in the bond markets.
House prices are set by mortgage interest rates.
In a rising rate environment, particularly when there is a bunch of low rate high grade convertible debt swirling around already, no one wants a mortgage bond. There is too much else for sale. So you get mortgage rates that just keep heading skyward. As they do that, they take house prices down with them.
There will always be an inverse relationship between house prices and interest rates. As interest rates go up, house prices go down. As interest rates go down, house prices go up.
There may be a slight bump in Toronto prices as folks who purchased properties out in the middle of nowhere move back to the city. Of course, the problem is that those people now are getting maybe 70 cents on the dollar, probably less, for their initial outlay and many of them are underwater.
The fireworks have not even started on this yet.