
I recently conducted a survey and I wanted to share the results with you.
I asked two people in the parking lot at my company if they like soccer, and both said no.
I have therefore concluded that 0% of people in Canada like soccer.
Wait, what?
Oh, sorry, I’m just proving a point about sample size and selective data analysis.
Two weekends ago, a client emailed me a Toronto Star article in an absolute panic.
The article he sent me:
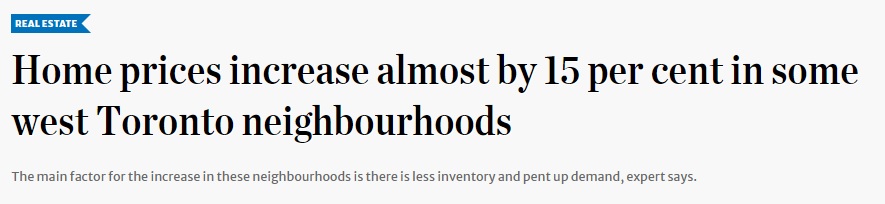
“Home Prices Drop Up To 31 Percent In Some West Toronto Neighbourhoods”
That’s the headline. Or at least, it was the headline, until it was updated.
And this, folks, is one of the craziest things I’ve seen in real estate reporting in a long time.
Here’s the URL:
https://www.thestar.com/business/real_estate/2022/06/09/home-prices-drop-up-to-31-per-cent-in-some-west-toronto-neighbourhoods.html
You read that, right? You don’t need to click, but rather read the URL.
Today, the headline associated with that URL reads:
This is so bizarre, and while you may be thinking, “There has to be more to the story here,” there really isn’t.
I believe that somebody jumped the gun on publishing a story about “real estate prices crashing” and they used data that was inaccurate or cherry-picked.
Here’s the correction they printed in the article:

This is a major Toronto newspaper that went from saying, “The market is down 31%” to saying, “The market is up 15%,” and it’s the same damn article.
Click on that URL – the one that shows “home-prices-drop-31-per-cent” and it’ll redirect you to the article about prices increasing 15%.
My point?
People are going to report what they want to report.
I don’t believe that, in 2022, it’s the writers’ fault. The editors and editorial boards of major newspapers all decide what news to report before there even is news to report. We know writers don’t pick their headlines. But do they even get to pick their own stories anymore?
As soon as the market began to change, I feared that we’d start to see really selective reporting on real estate stats.
But I also began to fear that real estate agents would say, “Nothing to see here, folks! All good!” And they are. I hear it every day from agents, brokers, and brokerages, and it’s insulting to my ears.
So today, I want to focus on the province of Ontario and look at how prices have fared in 2022.
We’re going to use the CREA HPI, specifically their seasonally unadjusted figure for “Composite Benchmark.”
Again, although I’m attempting to show what’s really going on in the market, you could accuse me of cherrypicking stats.
I can use the HPI or the average. I can use seasonally adjusted or seasonally unadjusted. And I can use any number of different benchmarks.
I would also argue, as I did above, that sample size can come into play.
The original article I referenced above, showings a 31% drop in “some areas” was based on a tiny sample size, on a month-to-month basis, for which I would never draw any conclusions, if it were me. You can’t look at a neighbourhood with 65 sales, and then 45 the next month, and say, “The market is down 25%.” There’s not enough data. With those sales figures, you could have three luxury sales in one month, and none in the next, and it skews the data.
That’s why the CREA HPI is useful.
So let’s look at the twenty-seven areas in Ontario that CREA tracks.
I want to run two sets of data:
1) December 2021 to May of 2022
2) March of 2022 to May of 2022
Why those two sets of data?
First of all, I simply want to see where we stand compared to the end of last year. And while we’re using the seasonally unadjusted, and December is usually slow, keep in mind that this is not an average but rather an HPI, so the figure is far less volatile to begin with.
Secondly, I want to look at the drop from the so-called “peak,” which we could argue was in February, but the HPI is trailing, so March is apt.
Shall we?
Here are the top-ten areas in appreciation from December of 2021 through May of 2022:
1) Sault Ste. Marie
December: $256,700
May: $320,700
+25.0%
The incredible part about Sault Ste. Marie is that the $320,700 in May is actually the peak. Prices have not trailed off since February or March, and this is one of only four areas, out of twenty-seven, that can make that claim.
2) Windsor
December: $582,800
May: $681,400
+21.1%
Windsor is one of the other three areas which saw a peak in May, along with Sault Ste. Marie. It’s no surprise to see those four areas on the top-ten list, with two at the top.
3) North Bay
December: $386,800
May: $459,600
+18.8%
As we’ll see throughout the data set, some of the areas with lower entry-level price points are the ones experiencing the highest growth.
4) Simcoe & District
December: $578,500
May: $674,700
+16.6%
For those who are familiar with this region, the next three or four areas on the list will come as no surprise.
5) Grey Bruce Owen Sound
December: $555,000
May: $645,200
+16.3%
This is another of the four areas which saw a peak in May, rather than February or March.
6) Peterborough & Kawarthas
December: $682,500
May: $793,800
+16.3%
Higher HPI figure than Grey Bruce Owen Sound, but an identical increase in the same time period.
7) Huron Perth
December: $568,000
May: $649,700
+14.4%
Call this GTA or call it Golden Horseshoe, but it seems like anything in Southern Ontario in the top half of our list.
8) Northumberland
December: $754,800
May: $860,600
+14.0%
This is between Oshawa and Belleville, for those that don’t know. It includes Port Hope, Coburg, et al. You drive through here to get to Prince Edward County.
9) Tillsonburg
December: $590,900
May: $671,800
+13.7%
This is the last of the three areas which saw a peak in May, along with Windsor and Grey Bruce Owen Sound. More on this later…
10) Sudbury
December: $414,100
May: $470,500
+13.6%
–
For the record, the only areas to see a decline from December through May are Oakville-Milton and Cambridge.
But how did those areas get to that decline? Through a big upswing, that’s for sure!
In fact, every area on the list saw a big upswing from December, through January, into February, and likely beyond. But it’s the decline in the past two months that’s responsible for those surprising losses in areas like Cambridge and Oakville-Milton, which, ironically, will top my next list.
I’ll save you the suspense with the “top ten” this time.
Let’s just look at the entire data set:
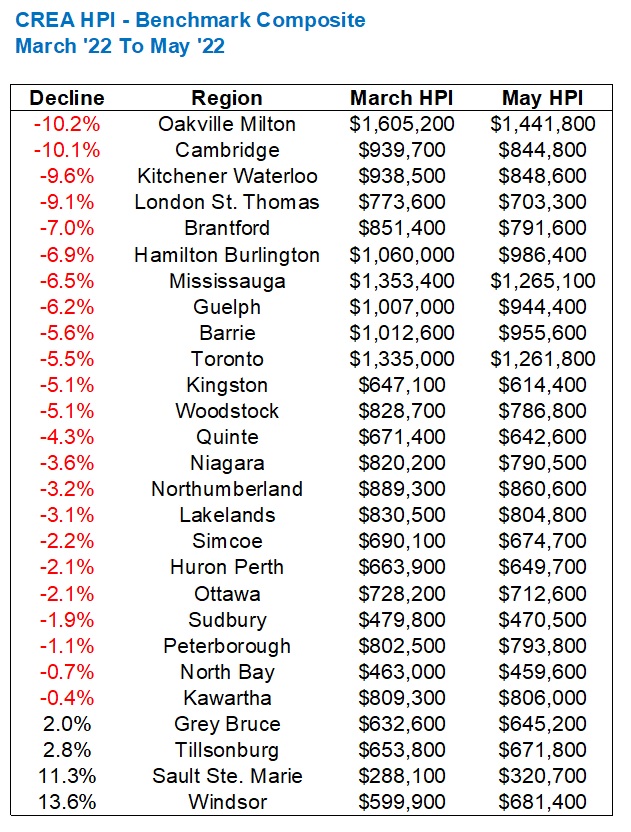
As noted above, only two areas saw an overall decline from December of 2021 through May of 2022 and those two areas are atop our list of March-to-May decliners.
But you can’t look at this data set and draw any conclusions other than, “The market seems to have declined.”
In 22 of 25 areas, the HPI is lower in May than it was in March.
What in the WORLD is happening in Windsor and The Soo? Your guess is as good as mine. Sample size, maybe?
The average of those twenty-seven areas results in a 3.6% decline. That’s not insignificant, but it’s also not life-altering.
For the four areas that sit atop this list, a 9-10% decline could be life-altering, if the property owner chooses to see it that way. As I said last week, people don’t day-trade real estate, so a buyer with a 10-year time horizion, seeing a 10% decline in two months at the onset, isn’t likely going to lament this in a decade. But as another reader pointed out, nobody is going to say, “Oh joy, a ten percent drop!” and put it completely out of mind.
Here on the Toronto Realty Blog, we talk about Toronto first and foremost. But I have always tried to talk about Toronto in the context of both the 416 and the GTA, as well as delving into other areas of Southern Ontario just for good measure. It’s impossible to discuss, analyze, and draw conclusions or make predictions about the City of Toronto without looking at the areas where another ten million people happen to live.
The conclusion you may want to draw after looking at the above data is that the market in Southern Ontario has been affected across the board. Well, I mean, save for Windsor and Sault Ste. Marie, which seem like the largest statistical anomalies I’ve seen in a decade, but I digress.
Some areas have been hit especially hard – on paper, but I would predict that over the next couple of months, every curve will get smoother, every line-graph will get flatter, and the market will normalize.
The original point of this exercise, in my mind, was to see how Toronto compared to the other twenty-six areas that CREA tracks, in Ontario. But it’s also interesting to see where Toronto sits on the list above, which is right in the middle.
With a 5.5% decline in the CREA HPI from March to May, it’s in line with the GTA’s average home price declining 6.7%, but not in line with the City of Toronto (416)’s increase in average home price, by 1.2%. Because let’s not forget that in the context of these CREA-defined areas, “Toronto” means City of Toronto, and not GTA, since other areas within the GTA are also noted in the chart above.
So which number do you take: the +1.2% or the -6.7%?
Well, ask somebody in the media to help. I suppose it depends on what story they want to tell that day.
Kidding! Just Kidding! Except, well, I don’t have to be.
On Friday, I want to run these numbers for the rest of Canada just to see how Toronto and some of it’s brother/sister cities in Ontario are faring by comparison…


JF007
at 8:00 am
David how come Brampton is missing from he above list ????
David Fleming
at 9:24 am
@ JF007
“Brampton” isn’t a category unto its own.
https://www.crea.ca/housing-market-stats/mls-home-price-index/hpi-tool/
Check out the areas they track.
Writer
at 9:28 am
Awesome article!
But since Toronto includes Brampton, York, and all other neighboring areas- it would be even more interesting to see a breakdown in Toronto.
Anecdotally, some areas have actually gone up and some areas like Vaughan are down by more then 15%.
Some areas are really difficult to sell anything at all.
Appraiser
at 8:50 am
Once again the 416 real estate market has proven to be remarkably resilient.
Vancouver Keith
at 10:40 pm
I’m telling you, this market is toast. Check out this listing in my neighbourhood. It’s a century old house, completely sympathetically renovated in East Vancouver, in an unfashionable neighbourhood. Huge square footage, rental suite standard lot with an apartment building being constructed to block the noise of the Skytrain. All that’s missing is a garage, which will take over a year to permit and cost the earth.
It was originally listed for $2 million, not only has it not sold in less than a week, it’s been on the market for 30 days. 30 days, people. Not just that, it has been reduced to 1.9 million. A price reduction people! We are in the type of market that prevailed – in the previous century. Real estate agents, take heed. A new era is dawning.
Vancouver Keith
at 10:41 pm
https://www.rew.ca/properties/4109731/1927-e-22nd-avenue-vancouver-bc?search_params%5Bquery%5D=Victoria+East%2C+Vancouver%2C+BC&searchable_id=402&searchable_type=Geography?search_params%5Bquery%5D=Victoria+East%2C+Vancouver%2C+BC&searchable_id=402&searchable_type=Geography
Condodweller
at 3:14 pm
Why is Windsor doing so well? I hear rumors that Tesla wants to put a gigafactory in Canada. What are the odds of it going in the Windsor area? Would that have an impact on local RE prices?
Hmm to think I was looking at multiplexes in Windsor in the $200k range not that long ago. As Buffett says his mistakes are not acts of commission but acts of omission.