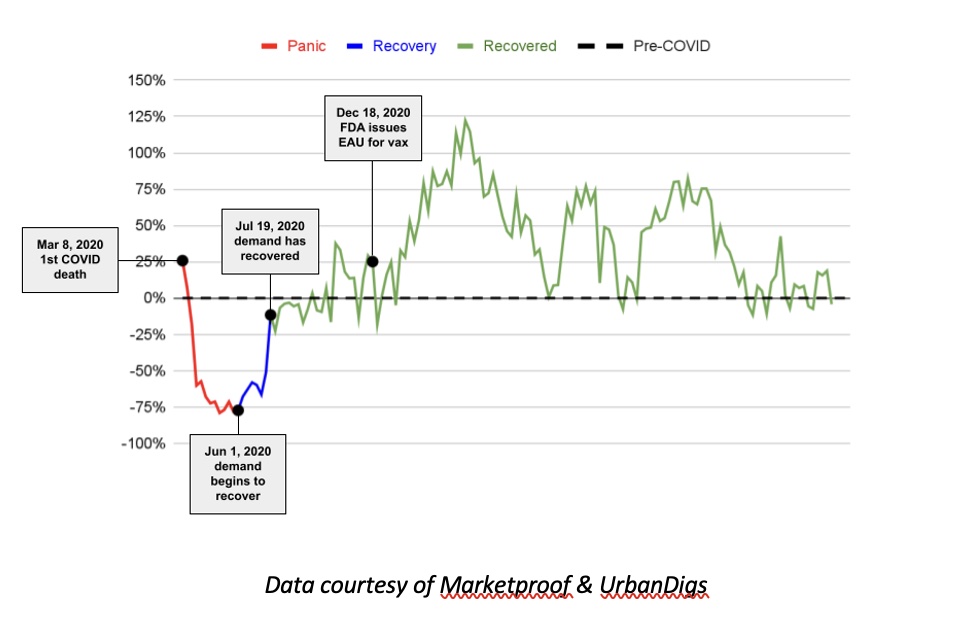
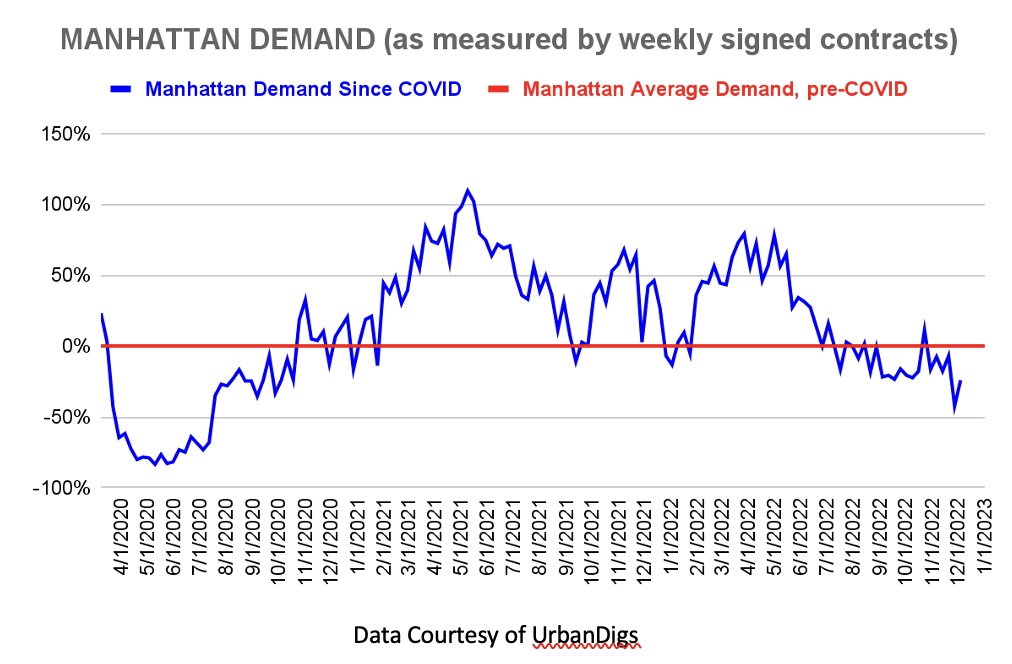
On March 8, 2020, the first death from COVID-19 was reported. By the end of May – not surprisingly – demand for New York City housing was down 78% from its pre-pandemic average. But on June 1, 2020, the unexpected occurred. Demand began to recover. And, on July 19, 2020, the impossible happened. Demand recovered. Let’s look at the past NYC markets and then ponder what is to happen in 2023.
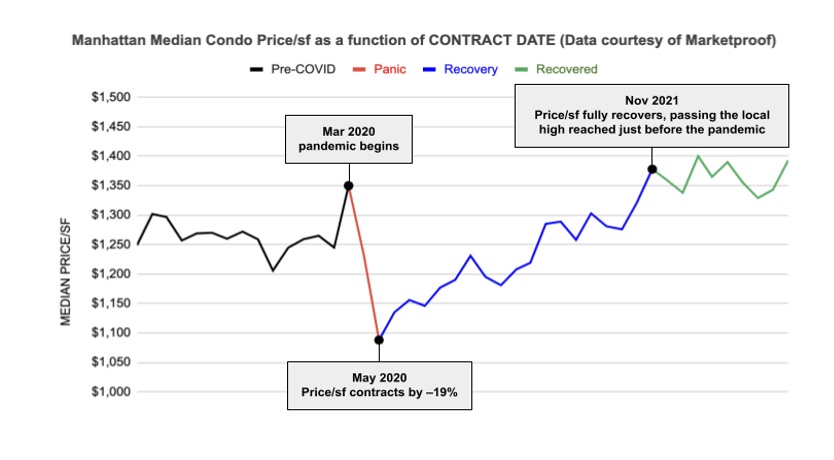
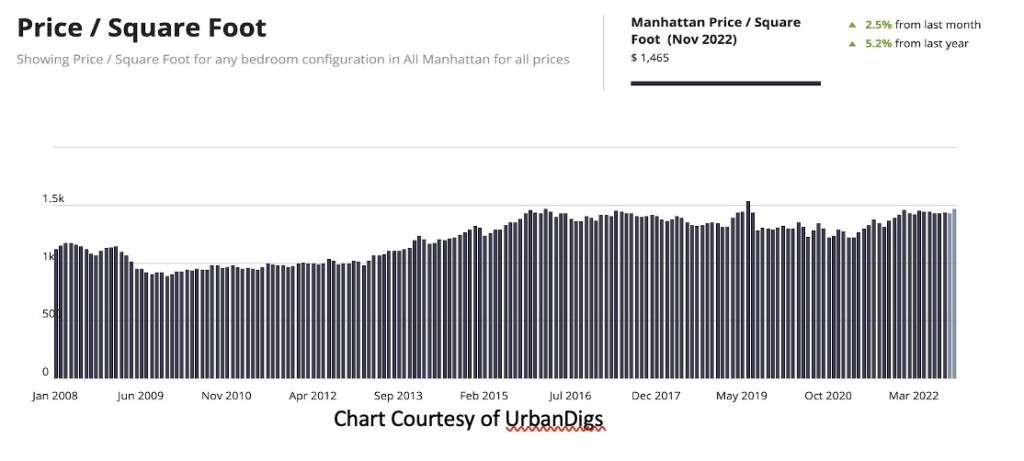
As the chart above illustrates, NYC’s elasticity during the pandemic was not limited to demand. Examining the past few years through a price-per-square-foot lens, we see that NYC absorbed the devastating blow of COVID-19 and recovered decisively.
What did the pandemic teach us about the NYC real estate market?
The pandemic showed us that the NYC residential real estate market can take a devastating blow, only to land softly and stand back up quickly. Sadly, this news isn’t news at all. Nor should it come as a surprise.
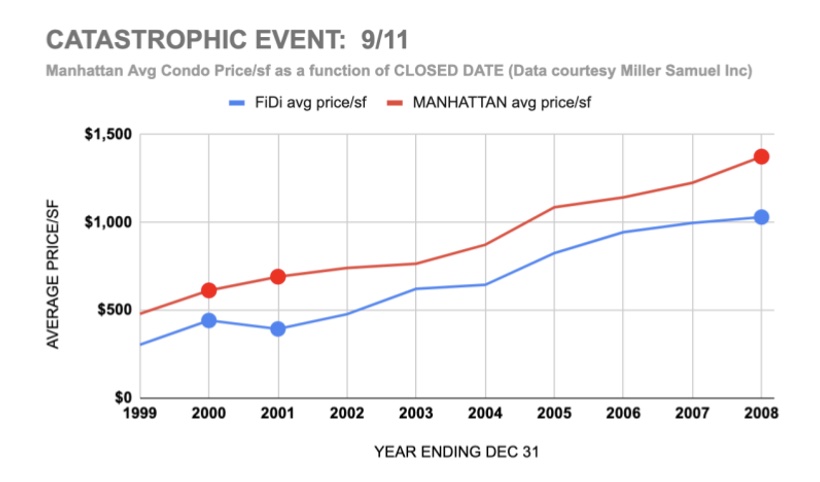
As New Yorkers remember all too well, the attacks on the World Trade Center occurred on September 11, 2001. As of year-end 2001, despite the trauma and fear that ensued, Manhattan’s average condo price per square foot had increased nearly +13% over the year prior. And even the Financial District (“FiDi”) which, of course, was the site of the terrible atrocity, had given back less than 11% of the prior year’s price/sf watermark. Over the course of the next seven years, Manhattan’s average price/sf doubled, while FiDi average price/sf increased by +161%.
The data presented herein memorializes what local, national and international investors have known all along: that NYC residential real estate exhibits one of the highest volatility capacities of any asset class.
Said more potently, NYC’s residential real estate market has the catastrophe-hedging potential of heavy metals, the appreciation potential of stocks, yet offers what no other asset class can – the ability to enjoy one of the world’s greatest cities.
Manhattan real estate market update – December 2022
Moving to the present, Manhattan has seen few significant changes in the real estate market since the pre-pandemic averages, yet again showing its resiliency and strength.
Despite the significant number of concurrent headwinds – lofty mortgage rates, losses within the financial markets, inflation, recession fears — many Manhattan metrics remain at pre-pandemic averages.
That’s a win. But, certain metrics are diverging from those pre-pandemic averages.
Where we are seeing great strength is in price per square foot, which has not only recovered post-COVID, but is on par with the high water mark set at various points throughout 2015 to 2019.
Where we see weakness is in terms of demand, measured by contracts signed. Although NYC demand (all boroughs) has been performing at or above historical averages since July (when climbing mortgage rates threw cold water on the 18-month period of record demand and price inflation), an outperforming Brooklyn has been carrying the weight of an underperforming Manhattan.
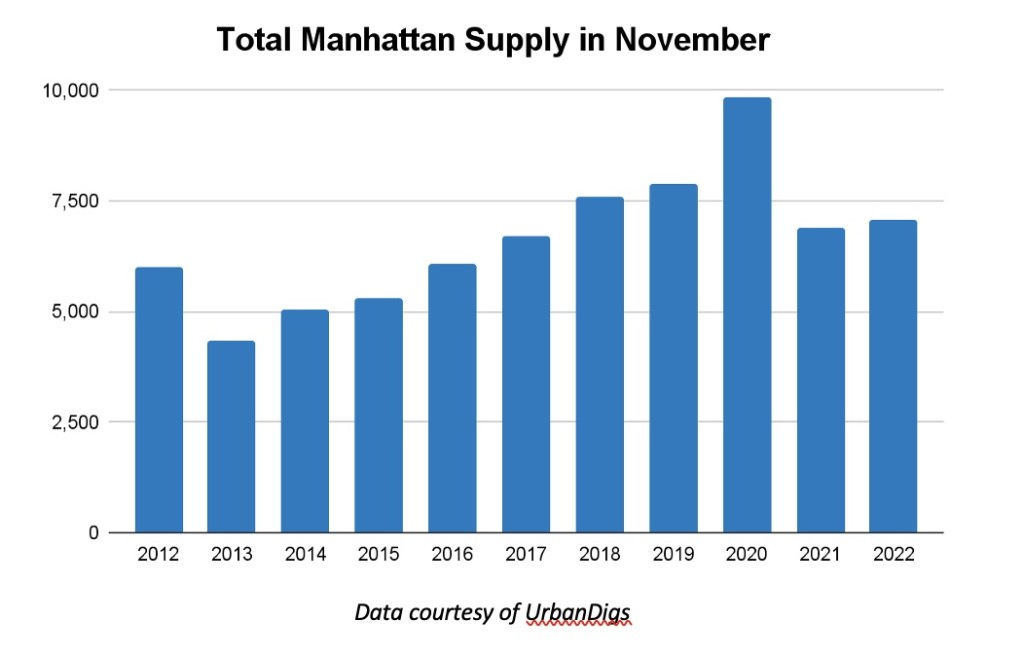
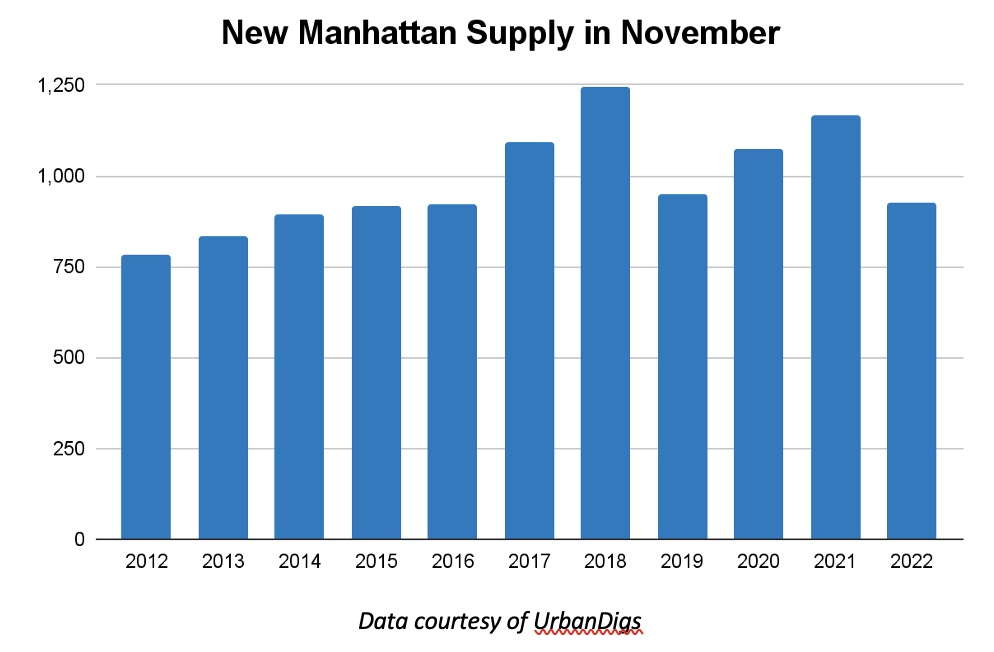
Manhattan supply
Why should you or your buyers/sellers be concerned with the number of for sale units in Manhattan? As a standalone number, there’s little importance and there’s certainly plenty to go around.
However, it is important to see November supply relative to historical levels. As mentioned, there are a number of deleterious forces swirling about, any of which could adversely affect the NYC residential real estate market. But as we see monthly numbers posted for the metrics we follow, including supply, many are historically normal and historically normal means a healthy market. Note: “Total Supply” refers to inventory on the market at a given time. “New Supply” refers to new inventory that came on the market in a specific time period.
Manhattan buyer activity
As noted above, demand for Manhattan residential real estate has been trending below its historical average. The graph below illustrates this insight, as this November posted the fewest contracts signed during the 11-year period observed.
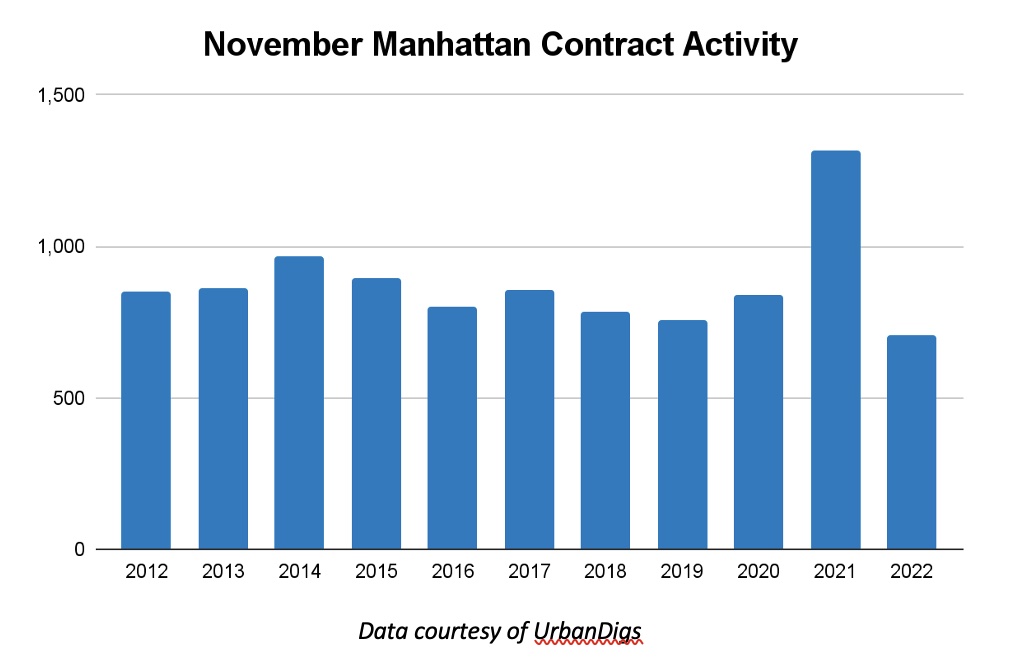
The graph below further illustrates our point, that demand has cooled from a record 18-month period that began Q1-2020. And as discussed, mortgage rates have pulled the trendline down to a level below the pre-pandemic average.
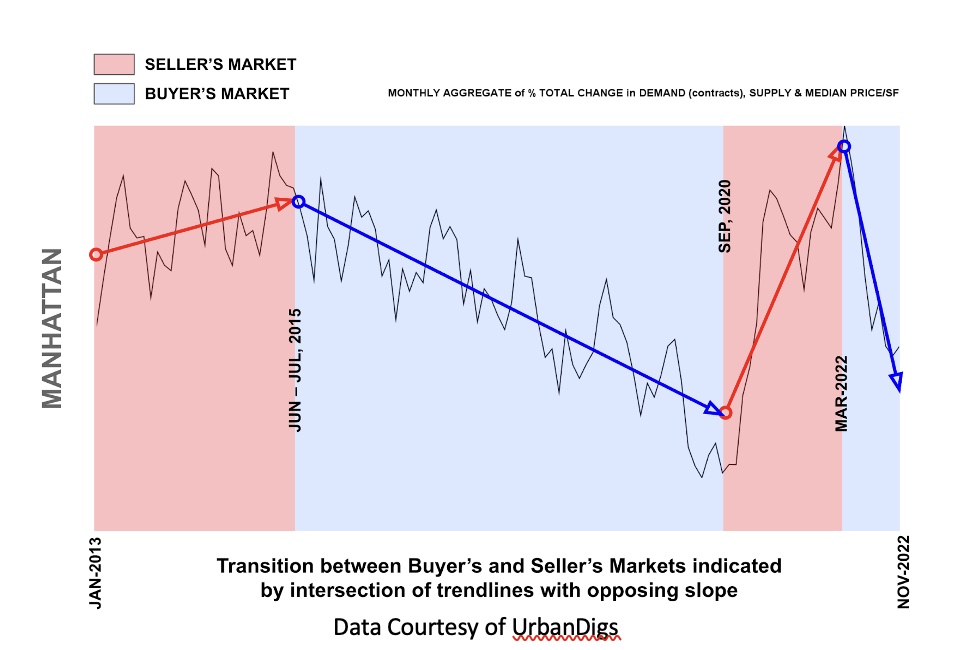
Manhattan leverage indicator
Elegran’s Leverage Indicator informs us whether the current is a buyer’s or a seller’s market; i.e, which party possesses transactional leverage Looking at the graph below, this is indicated by the direction of trend lines. Our indicator also informs us regarding the relative strength of that leverage, indicated by the slope of those trend lines. Per below, Manhattan is in the grips of an exceptionally strong buyer’s market.
Price per square foot and discounts
A brief look at the chart below reveals that, following the COVID pullback, price/sf has quickly returned to previous highs reached at various points throughout 2015-2017 and 2019.
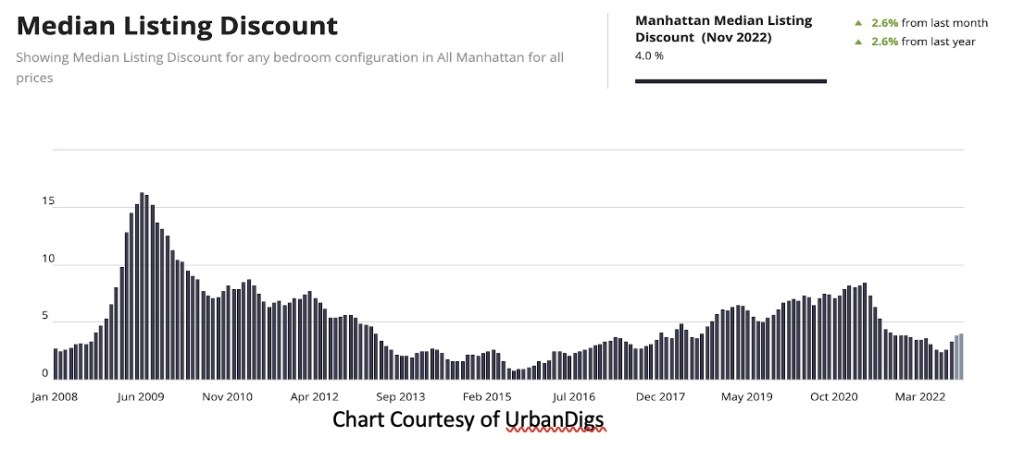
The accretion of COVID pent-up demand and future demand pulled forward by rising mortgage rates quickly brought listing discounts down throughout 2021 and part of 2022. However, as mortgage rates continued to rise and cooled demand over the summer, discounts have begun to ascend again, as the chart below illustrates:
What does this all mean?
Buyers:
- Supply became markedly overheated during 2021 and some of 2022 and mortgage rates have curbed demand to below pre-pandemic levels, keeping Manhattan in the throes of a strong buyer’s market. Remember, a buyer’s market means that buyers should be rewarded for their patience.
Sellers:
- The current market favors buyers, so sellers need to set their expectations to pre-pandemic levels, not at 2021 levels or even 2022 levels where demand and price inflation were robust.
- Sellers who are not commanding their desired sales price should consider renting their home instead, at least for a year or two, and capitalize on the strong rental market and high rents.
Renters:
- Although peak rental pricing has cooled slightly, rents remain significantly inflated as mortgage rates keep would-be buyers from participating in the for sale market and force them to rent instead.
Investors:
- Rents are still historically high, but price/sf is well on its way, so the value proposition of an investment apartment for an all-cash buyer is still interesting, but no longer a slam dunk.
- Foreign investors; however, depending upon their native currency, have the opportunity to realize significant capital gains upon the sale of their asset.
Jared Antin is managing director of Elegran Real Estate in New York, New York.