
I’ll be honest here: I had originally selected a different photo for today’s blog.
While searching with the “weather” theme, I found a beautiful photo of a giant lightning bolt striking down from the sky, with city lights below. But then I thought, “Maybe people won’t see the beauty that I see? Maybe they’ll see the dark, gloomy, depressing side of this photo instead?”
So I went with the bright and happy photo that you see above!
There are two sides to every coin, and where one person might smile, another might frown.
As I write this blog on Tuesday afternoon, I’m currently involved in a 31-offer melee on 10 Fennings Street in Queen West. My clients might have been inclined to frown, and say, “I can’t believe the amount of competition on this property, we have no chance.” But instead, they smiled, and said, “You told us that most offers will be ‘throw-aways,’ so what price do we need to offer to be successful?”
In the downtown condo market right now, half of the market participants are rejoicing while others are lamenting. The latter half are experiencing frustration, regret, and, oh yeah, hindsight.
As Monday’s blog post detailed, the Toronto condo market is on fire. Yes, fire. I’m not even going to say that it’s “hot” but rather it’s on fire, because it is.
My colleague came to me in November and asked me to price her King West condo. She said the clients “wanted” $700,000. I responded with the same cynical answer that I always provide in a situation like this: “That’s what they want, eh? Why not $750,000? Why not $800,000?”
Because it didn’t matter what the clients wanted. That property was worth about $665,000 in that market.
Today, she listed the property for sale at $699,900 and there have been 16 showings booked already, with multiple agents drafting offers.
I have a dozen other stories that I could tell, but I’ll stop short of that right now and get to my thesis for today.
What if we knew when condos were going to increase in price?
What if we knew when they would increase in price relative to other housing types?
A colleague of mine, who I mentioned in Monday’s blog post, had floated a theory that I wanted to test.
How big can the gap between houses and condos go before buyers start to flock to condos once again?
So I decided to set out with as much data as possible to try to find a correlation. And that can be problematic; when you’re trying to find a correlation, as you can often be guilty of confirmation bias.
Therefore, I’ve decided to conduct this experiment in real time!
Because hindsight is ever-present in this particular experiment, I am going to post write this blog post as I examine the data, live.
Together, we’ll be the judge of whether or not we can use past pricing to forecast future trends.
First, let’s plot the 416-detached housing price against the 416-condo price:

This looks like two jagged lines to you, and don’t worry, it looks the same to me.
It’s the gap between the two lines that interest me, specifically the relative difference, not the absolute.
In January of 2012, the average detached house price was $743,993, and the average 416-condo price was $343,835. That gap is $400,158.
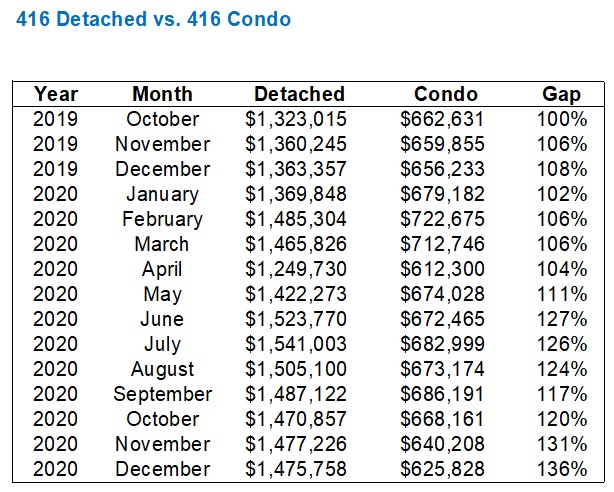
In December of 2020, the average 416-detached price was $1,475,758, and the average 416-condo price was $625,828. That gap is $849,930.
The gap has grown substantially! Right?
But on a relative basis, the gap has merely grown from 116% to 136%.
That is to say that in January of 2012, it cost 116% more to purchase a detached house than a condo, and in December of 2020, it cost 136% more.
The gap has grown massively on an absolute basis, but not so much on a relative basis.
So where can we look at the change in the relative differences and try to spot a potential uptick in condo prices?
The highest this gap has ever been was back in February of 2017 at 205%.
By the end of 2017, detached prices had declined by 20.6%, but condo prices had increased by 3.4%. We know that 2017 was an odd year in the market and that April saw a large drop in prices and sales, but this “peak” gap between detached and condo prices could have served as a sign of things to come in the market.
By the end of 2018, detached prices had declined, on paper at least, by 27.2%, but condo prices were up 15.3%.
This is all hindsight, but if you were able to identify when the gap in pricing was overblown, you could certainly identify when the condo market was going to rise.
Now let’s say you were sitting down at Christmas looking at the state of the freehold market and the condo market, and you wanted to forecast whether 2021 could see a rise in condo prices.
How would it help to look back at this pricing gap?
Again, with the benefit of hindsight, we have to be careful.
These price gaps pale in comparison to the 205% we saw in February of 2017, but the trend we can see is that the gap between detached and condos is growing.
What’s to say this gap doesn’t grow in January, February, and beyond? Nothing, perhaps.
Now, let’s move on to 416-semi versus the 416 condo:
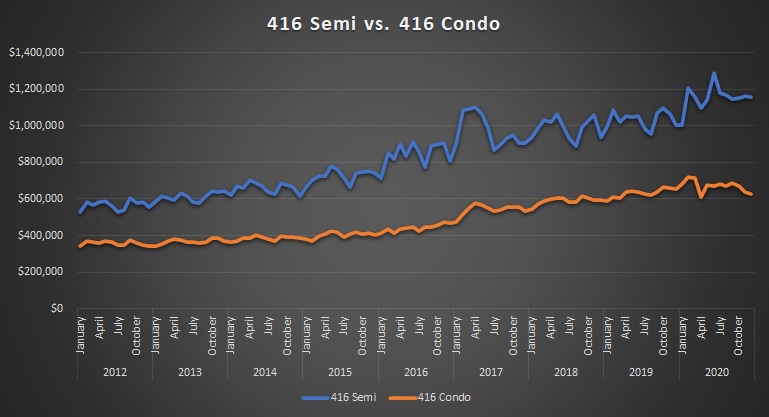
To be honest, the 416-semi line is quite similar to the 416-detached, it’s just less volatile.
This gap peaked in February of 2017 at 111%. But that’s the same peak as we saw in the detached market, so we either have consistency or we have a coincidence. And if we do have consistency, is there any data from which we could have made an accurate forecast?
This gap was at its lowest in August of 2018 when it was merely 52%.
This gap widened to as much as 78% but narrowed back to 54% the following August in 2019. In that time, semi-detached prices rose 7.3% and condo prices rose 5.8%.
Now here’s the kicker: since August of 2019, semi-detached prices have risen 21.3% and condo prices merely 1.1% on account of the massive decline in condo prices in the latter-half of 2020.
So if we replicate the same chart as we did above, will we draw any inferences?
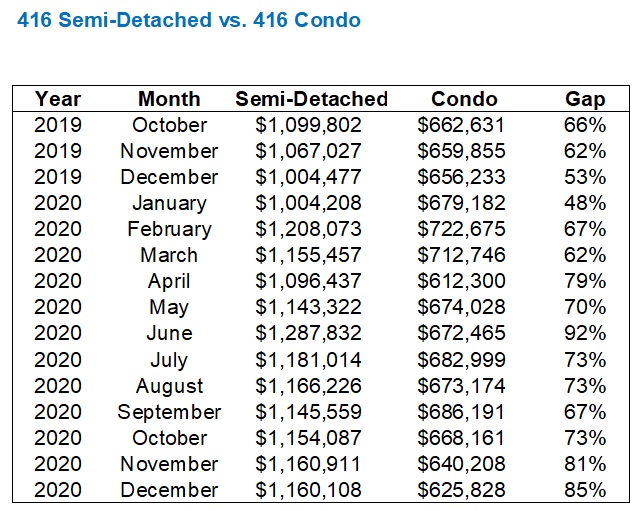
Not really.
As with the detached chart, we saw the gap widen significantly by December, but these gaps in 2020 are far more volatile. Up, down, up, down.
So perhaps the averages won’t help us?
Let’s use the HPI instead:
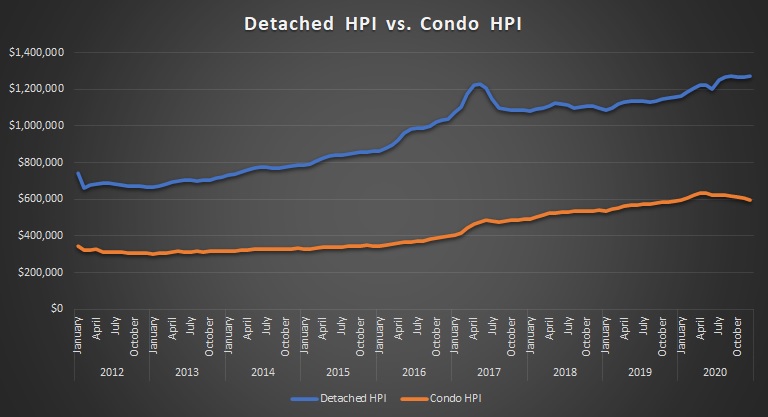
This time, the gap is actually its widest in 2016 – June, to be specific, at 168%.
For what it’s worth, the February 2017 number isn’t far behind at 165%, so even the HPI is consistent with the detached average and semi-detached averages above.
The curve is smoother, and maybe, just maybe, if we replicate the same chart as we did above, we’ll see an indicator toward the end of 2020:
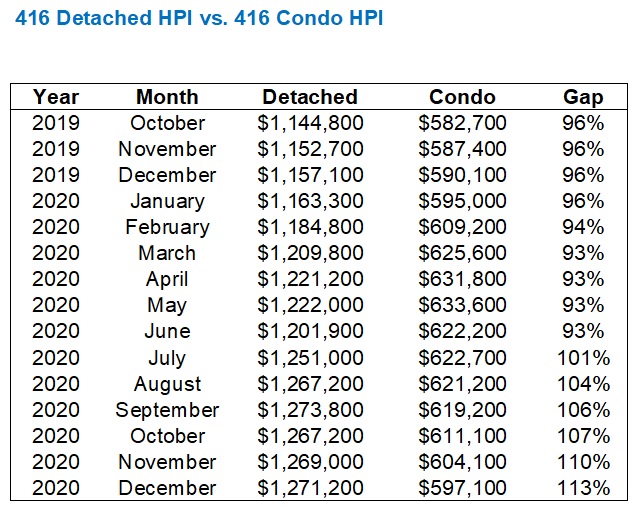
Okay, so the HPI is smoother and thus the gap widens without any volatility.
However, we still have absolutely no idea how large that gap will be before the market turns around.
And that’s the problem here, folks.
What’s to say that the January gap isn’t 118%, and February doesn’t check in around 122%, before the condo market turns around?
But it DID turn around!
I’m living it as we speak!
We live and die by the average prices, and many of us know by heart that the average condo price peaked over $722,000 in February of last year and finished 2020 just over $625,000.
(that’s $722,675 and $625,828 to be exact, but my memory was pretty good…)
So if we’re in the spirit of making predictions, how about one from yours truly?
When the TRREB numbers are released next week, we will see that average condo price over $655,000. And by the end of February, it will be over $675,000. By April, we’ll be nearing $700,000.
Screenshot it, print it, record it, I’ll stand by it.
But at the risk of making this blog post about something else (because it’s not about predictions, but rather to use data for accurate forecasting), can any of us look at the charts or statistics above and accurately predict the future?
I’m all ears if you have suggestions.
I think back to my university days, looking at technical analysis of stock charts.
Martin Pring and John J. Murphy.
Moving averages, Bollinger bands, and oscillators.
Is there a way to use a rolling average with respect to that gap between the price of a house and the price of a condo, and when a particular month’s gap exceeds the 6-month moving average, we set off an alarm bell? Or a 12-month moving average?
There has to be a way.
There’s just too much data to not find an accurate forecasting tool.
Only, I’m not able to find it.
I look at the data above and I see nothing that could be used as an indicator of a particular market segment moving one way or another, relative to a different market segment.
The truth is, the best indicator I have is still my “feel” for the market. It’s not a predictive tool, but one that tells me exactly where we are in the market – something the statistics often ignore.
The market is literally changing by the day. I spent Tuesday night on the phone until 10:30pm, and one phone call was with a lady who is thinking of selling her condo, and a different agent gave her a strategy that I thought was absurd. But then I realized: he probably isn’t out there every day. He might not have been out there last week, let alone tonight. You have to be in this market up to your neck to understand what’s going on. So even if we did have a forecasting tool that was based on past data, I fear the market could still do a one-eighty before you could click =SUMIF in an Excel document.
Today was a wild day. As you can tell, I finished this post after a long day and even longer night, and the agents I’m chatting with over text right now are all licking their wounds.
Folks, I can’t explain what the market is like out there right now. Houses, condos, low-end, high end. Durham Region. Durham! It’s all nuts.
To my colleague who wanted to know if we can use past data to forecast the condo market, I’m sorry, I don’t think we can. We tried! But I don’t see it. Do you?
Happy to hear from the analysts on this one. Also happy to email you my spreadsheets if you want to play around with them.
See you Friday, folks!


Jimbo
at 8:50 am
Can I get a copy of the spreadsheets?
Kyle
at 9:26 am
If there is a technical signal in the numbers, my guess is that it would be in how much each housing type diverged from the overall market, rather than how much each type diverged from the other types. That said, i’m not a big believer in market rules or ratios, and i think a big part of what’s driving the current condo market has to do with unique factors.
David can probably tell us whether he is seeing more end user or investor activity, but i suspect a big part of what’s driving the condo market today is FTHB who have been shut out of the market and are now seizing their opportunity. Condo buyers are in a much better financial position compared to this time last year. When they were faced with prices escalating faster than they could save for a down payment. This year, condo prices are down, interest rates are down, and for many of them WFH would have allowed them to save on things like rent, commuting costs, entertainment, vacation, childcare, clothes, gas, car maintenance, etc.
Appraiser once again called this bottom (third time by my count), kudos to him.
Appraiser
at 9:52 am
Thanks Kyle.
I think your analysis regarding FTHB is logical and that the market is proving to be logical as well.
As if any more evidence of a T.O. condo rebound is required:
“With condo sales picking up and listings dropping, things are tight again. First time MOI lower than freeholds (which is also tight) since last April 7. Again: Condo market has really intensified recently. Not cheering that on, just pointing out.” ~Scott Ingram CPA, CA
https://twitter.com/areacode416?
Jimbo
at 2:14 pm
It is a scary thought to think a fthb can only get in the market because they could WFH and save money by living with parents.
Almost like that would be the end of the road.
I think they always had the money, but with the vaccine just around the corner are willing to play lockup for a few months before they can enjoy the city again.
Kyle
at 2:54 pm
I think we’re think about it differently. I’m talking about FTHB finally being able to save more down payment without it being outpaced by the market. I’m not suggesting that that they can now afford ongoing payments because they’re living an austere pandemic lifestyle. When it comes to financing the Banks will make sure they have sufficient income and won’t care about any temporary drop in their expenses.
Jimbo
at 7:11 pm
The top part was about the saving part. Not having $2,000 rent to pay, insurance, groceries, electricity, etc. Not able to keep up and bring outpaced is the scary thought. It is scary because that is the environment we will be going back to and if they are outpaced that could mean the end of the road.
The bottom part, I meant, the majority of buyers are more willing to move back downtown, pay a mortgage and wait out a few more months of lockdown before life goes to normal. Reason being, it will be cheaper now than in July-September when lockdowns stay to lift.
Kyle
at 8:19 pm
Got it, i misread your comment. Agreed, this could very be the closing of what was a very short window of opportunity for those looking to get on the property ladder.
Joel
at 9:26 am
I think the anomaly we have seen over the last year and going forward is the rental and air bnb market. Too many unknowns for new investors and many current investors getting out.
Although impossible, it would be great to see this data divided between owner occupied and rentals across the condos and also at what rate the condos for sale are being absorbed by investors vs end users.
Condodweller
at 4:05 pm
David should have enough visibility to speak to this between his own deals plus his brokerage’s and get an idea from other agents he knows.
Dave
at 11:43 am
Dave – Suggest you provide the data in .xlsx. There are folks who read this blog who should be able to crunch some useful stats for you.
David Fleming
at 4:03 pm
@ Dave
I have to see if there’s a function to upload a document to the post. I don’t know that there is, but I’ll look into it!
If anybody wants the stats, email me: davidfleming@bosleyrealestate.com
Condodweller
at 4:07 pm
David, you can always just share it from a Google drive.
Dickson L.
at 5:24 pm
It should be possible to upload Excel spreadsheets using the media library, then reference it via either a link, button or file block. More details here:
https://wordpress.com/support/uploading-documents/
hoob
at 11:44 am
Your first chart is wrong (it is also for 416-semi, not for 416-detached.)
David Fleming
at 4:01 pm
@ hoob
That was embarrassing.
Fixed now! 🙂
Caprice
at 11:57 am
Holy smokes, the sale price on that semi at 10 Fennings! Lucky #8
Marty
at 1:11 pm
BEST LINE(S):
Today was a wild day. As you can tell, I finished this post after a long day and even longer night, and the agents I’m chatting with over text right now are all licking their wounds.
Folks, I can’t explain what the market is like out there right now. Houses, condos, low-end, high end. Durham Region. Durham! It’s all nuts.
– good read, David. Keep up the good work.
Mark
at 2:03 pm
This FOMO will subside, lots of inventory coming up. The realtors that are fueling this frenzy by listing properties low and sitting back, too lazy to list at what the property is actually worth…are making more disgruntled consumers REMEBER them and they’re marketing, for example 1 winner and 30 losers on an offer. Magical 699 listings, now seeing 399.Those 30 will negatively associate you and judge you on the lack of professionalism and greed. This is a referral biz. Not a good look. Its not like there will never be another house to buy. The realtors that are left standing are the very few good ones, they will be sought out for years to come. Think you’ll be ok David. Lol.
Condodweller
at 3:21 pm
Funny the last time I tried to suggest the use of stats and moving averages to predict housing prices one of the resident bulls laughed at the idea. I don’t know if housing prices are cyclical enough for any sort of short term prognostication. When I was suggesting it, it was to determine if the current high indicated an overbought condition. With stocks there is a range like above 70 is considered overbought and people start buying over 80. Below 30 is considered oversold and people will start buying below 20 and back up the truck under 10. I mean the recent drops in 2017/2020 would probably move the needle from overbought to perhaps not so overbought. Probably nowhere near oversold conditions.
With the gap between the two the question is which one is out of the norm that you expect to reverse. There are two ways to reduce the gap.
Clifford
at 4:57 am
Right after I sold my condo. I knew this would happen. The only thing that keeps me from crying is I had to sell in order to buy a new construction which has gone up several hundreds of thousands of dollars when las year I was nervous the appraisal would come in lower than I paid.
I also feel vindicated as I told the bigger bear posters here that condos would rebound. My buyer must be feeling great. Her realtor said “condos are crashing, you want too much” glad I didn’t budge.
Whaaa?
at 2:57 pm
@clifford
Well done. Sticking to your guns.
J G
at 1:37 pm
I won’t even talk about the FAANGs anymore because they can’t even be compared to Toronto RE. Google just broke $2k after earnings.
London: Avg. price Jan 2021 –> +40% in 1 year to $605k
https://www.lstar.ca/sites/default/files/statistics/LSTAR_Residential_Market_Activity_Report_January_2021.PDF
Windsor: Avg. price Jan 2021–> +35% in 1 year to $510k
https://wecartech.com/wecfiles/stats_new/2021/jan/
Andrew
at 1:52 pm
@ J G
I wanna hear about your GameStop play. Do tell.
J G
at 4:49 pm
I laughed and trolled on WSB, but due to low Karma my posts just get deleted.
Poor kids. But I think these paid lessons are much more valuable then what Universities provide.
Whaaa?
at 2:58 pm
Yaaaaaaaawwwwwwnnnn!!!!
Batalha
at 3:25 pm
Yes, because GOOGL and Toronto RE are TOTALLY THE SAME THING! Geez, man, give it up, you’re not helping anyone (but I guess that’s not the point of your completely pointless posts, is it?). If only I believed that you “won’t even talk about the FAANGs anymore,” but of course from painful experience we all know better than that.
Chris
at 4:28 pm
If you’re assessing Toronto RE as an investment opportunity, rather than as a place to live (we’ve already discussed ad nauseum how renting compared to buying is highly dependent on individual priorities and circumstances), then it absolutely should be compared to alternative investments, such as the shares of large corporations.
Whaaa?
at 5:07 pm
But remember, Chris, that JG touts individual companies (like, six of them) which is much more dangerous/problematic than looking at one (or a few) individual buildings in a CMA/agglomeration of more than six million people. Not that I think anyone who follows this blog considers JG’s touts as even remotely serious, let alone actionable. But let’s call out a clown when we see a clown/shit-disturber.
Chris
at 7:10 pm
You’re correct, and I wouldn’t recommend investing entirely in a handful of US tech stocks anymore than I would a downtown condo. Rather, I’d suggest something like VGRO/XGRO or VBAL/XBAL
But, let’s also not pretend these are fringe companies or risky penny stocks. The FAANGs together comprise ~15% of the entire S&P500. They may not quite be universally considered blue chips, but they’re pretty close.
J G
at 5:33 pm
@Whaaa?
What you talking about? You think Apple/Amazon/Google/Facebook are the same as Gamestop? You’re a clown.
J G
at 6:39 pm
Wow, a city of 6 million people, big deal! San Fran RE and rent cratered too during covid too, and it’s much more expensive there.
-Did FAANG clearly outperform Toronto RE over the past 10-15 years? YES
-Do these companies make sh*t load of money each year (and growing)? YES
-Do most people and companies, esp. wealthy ones, use their products and services? YES
-Are they still going to be around 20 years from now? YES
Of course it’s actionable! Amazon @$3300 USD, expensive yes, but if you can afford a condo, you can definitely load up on FAANG.
And for people who still have nightmares of Nortel/Enron/BlackBerry, sorry welcome to the present.
J G
at 4:59 pm
Gee tough crowd, thank you Chris.
@Others – I provide a comparison for returns of different investments.
Apple: 73%
Amazon: 62%
Google: 42%
London RE: 40%
Windsor RE: 35%
416 condo: -9%
Yes it’s 1 year return, but a a swing between -9% and +70% is huge.
Caprice
at 5:38 pm
https://i.pinimg.com/originals/cc/bc/cb/ccbccb6f2d0a2b6c37c354b076ea902c.gif
Chris
at 6:59 pm
You may not, but most rational investors do indeed care about returns.
Professional Shanker
at 7:07 pm
A couple things to note, FANG is not the market so a more accurate comparison would be to use the S&P or MSCI World index.
Also, right or wrongly leverage in real estate makes the equation and actual ROI much different and should be factored in unless you are trading on margin (higher IR compared to a mortgage) or options or buying warrants, etc.
I owned Amazon before it was profitable, it was by no means risk free back then and there is no guarantee all of these companies will be a great investment 20 years from now, plenty of examples from yesteryear – GE, Exxon to name 2.
Chris
at 7:15 pm
…”unless you are trading on margin (higher IR compared to a mortgage)”
Not quite. Interactive Brokers offers USD margin rates between 0.75% and 1.59%, and CAD margin rates between 0.5% and 1.5% (for IBKR Pro).
Professional Shanker
at 9:39 am
Most margin accounts are not provided at 1.5%, IB is I guess.
Chris
at 10:05 am
Sure, most are quite a bit higher than IBKR. For example, TD is currently charging 4-4.5%.
But if you’re using margin to invest, I’m going to go out on a limb and guess that you’re savvy enough to compare interest rates and select the brokerage that provides the most compelling offer.
Kyle
at 7:12 am
@ Professional Shanker
Agreed, most RE is bought with leverage and because RE price volatility is low, this is a perfectly rational thing to do, especially when you have a long time horizon. I think the vast majority of people would soil their pants multiple times a day if they had their lifesavings levered up 5x in the stock market. And to maintain that leverage over a long time horizon is a recipe for ulcers and heart attacks.
If the Gamestop saga highlights one thing for me, it is the extent to which stock prices can and are manipulated. I know the bears will trot out their conspiracies about how RE prices are manipulated, but the reality is residential real estate is mostly bought and soid by individual market participants, who buy and sell individual properties. No participant has an outsized influence on the overall market. There is no short-selling of RE, which means there are no pump and dump strategies manipulating RE prices, there are no algorithms trading properties, and there are no billion dollar hedge funds out there colluding on strategies.