In a recent report, the National Association of REALTORS® pinpointed the markets expected to excel in 2024. After evaluating the performance of each market across 10 different metrics, the selected areas are projected to experience a boost in housing demand as mortgage rates are predicted to trend downward in the next year.
In the coming weeks, we will post a series of blogs that will delve deeper into each of these 10 indicators included in the study.
The key determinant impacting housing demand in these areas is the influx of additional buyers resulting from the decline in mortgage rates next year. Changes in mortgage rates have a direct impact on borrowing costs. Higher mortgage rates increase the cost, while lower mortgage rates help with affordability, giving individuals more financial flexibility. Specifically, the monthly mortgage payment is $2,215 with a rate of 7.5%, while the monthly cost drops to $2,005 when the mortgage rate is 6.5%. As a result, the qualifying income decreases to $96,145 from $106,370. Hence, with this decrease in mortgage rates, more people can purchase a home without exceeding their budget. At the national level, it’s estimated that 5.8 million households will once again afford to do that.
Delving into the demographics, most of these “returning” buyers are older millennials, aged 35-44. More than 1.1 million households in this age group will again be able to afford the median-priced home if rates drop to 6.5%. Most importantly, nearly 30% of those “returning” buyers are still renting a home while they could purchase a home with a value of $375,000 by spending the same amount they spend on rent ($1,890). Finally, when considering race groups, it seems that Hispanics are poised to benefit the most from the anticipated decrease in mortgage rates next year. 4.7% of all Hispanic households – 818,820 Hispanic households – will be able to purchase the median-priced home, followed by 4.6% of their white counterparts (4.0 million). This could push up the Hispanic homeownership rate even further next year. Meanwhile, over the past decade, Hispanic homeownership has demonstrated the second-highest rate of growth (5.2%), following closely behind the gains seen in Asian homeownership.
Among the 100 largest metro areas, Madison, WI, El Paso, TX, and Durham-Chapel Hill, NC, are the areas with the largest pool of “returning” buyers, assuming rates will drop to 6.5%. More than 5.5% of their households will be able to afford the median-priced home in these areas. However, in certain smaller areas, the proportion of buyers returning to the market is estimated to be even more pronounced. In Lawton, OK, 8.9% of the households – 4,248 households – will be able to afford again to buy a home. Yakima, WA (7.4% or 6,484 households) and Cleveland, TN (7.3% or 3,627 households) follow with a share higher than 7%.
Relative to the population of each race/ethnic group, among the 100 largest metro areas, most Black Americans will benefit from the anticipated decrease in mortgage rates in Portland-South Portland, ME (12.6% of Black Americans), Bridgeport-Stamford-Norwalk, CT (7.9% of Black Americans) and Boise City, ID (6.9% of Black Americans). The influx of these additional buyers can potentially boost the Black homeownership rate in both Portland, ME, and Bridgeport, CT, where the current Black homeownership rate is below 30%.
Respectively, Madison, WI (12.7% of Hispanic Americans), Pittsburgh, PA (10.4% of Hispanic Americans), and St. Louis, MO-IL (10.2% of Hispanic Americans) are the metro areas with the most Hispanic Americans who will afford once again to purchase the median-priced home. These additional buyers could increase the Hispanic homeownership rate in Madison, WI, and Pittsburgh, PA, as there are significantly fewer Hispanics who own a home in these two areas compared to the national level.
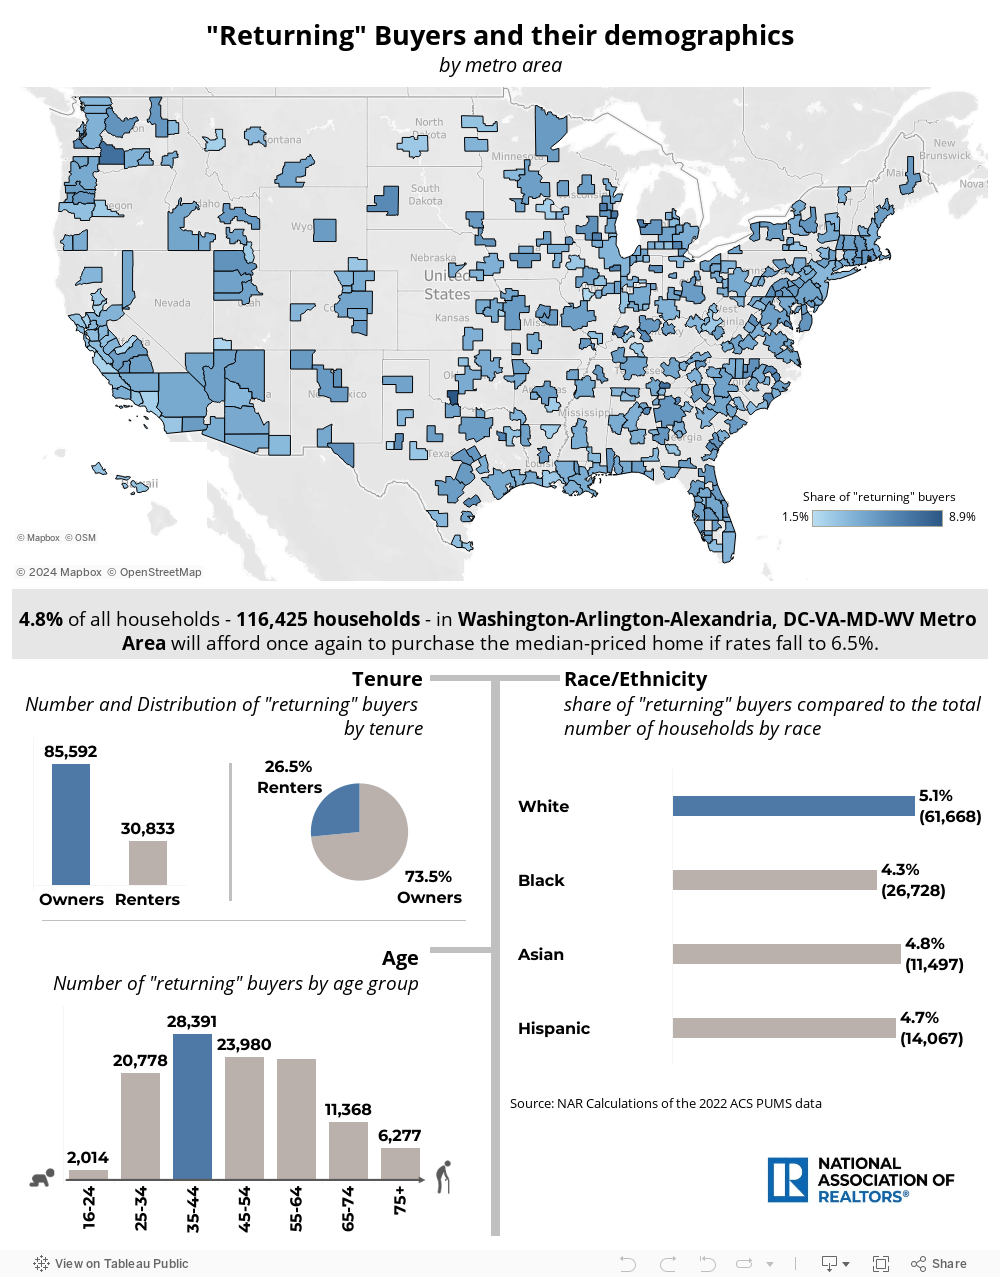
Use the map below to see the actual count of “returning” households and their demographics for each metro area.