
Monday, August 10th, eh?
2020.
Years from now, the mere mention of “2020” will give us all goosebumps.
In previous years, hitting August 10th on the real estate calendar would just about spell the start of the annual summer slowdown. The last two weeks of August are typically quite slow, and even I would look forward to a slower pace.
In 2020, this couldn’t possibly be more to the contrary.
Having just moved three listings last week, we’re gearing up for another three in the next two weeks. I had one seller all set to rush to market for August 25th, but their conditional sale of a Guelph home fell through. Yes, another Toronto home-owner leaving the city. Their time won’t be this month, but it will be soon.
The interesting part about that last seller, and the conversation that ensued, was that we were going to move heaven and earth to get the property ready for staging on August 21st, so we could list on the 25th, review offers on the 31st, all so we could avoid listing after Labour Day.
Avoid listing after Labour Day? What the?
Yes, I know, this is new for 2020. In years past, I would be advising sellers to wait until after Labour Day. But this year, I see a dearth of inventory in the freehold market on the horizon in August, and buyer demand is still high. With the annual dump of listings post-Labour Day, I think it’s advantageous for some sellers to hit the market now.
Last Tuesday, I provided my “Five Burning Questions” with respect to the July TREB numbers, looking at five statistics that I was eager to review.
One was with respect to the overall average home price, three had to do with condos in some way, shape, or form, and one was looking at entry-level freehold.
While I could go over any number of stats from last month, I figured it would make sense to actually answer those five questions, since that might provide some insight into how the market reality is lining up with the vibe, the anxiety, the prognostications, and the buyer and seller sentiments out there.
Let me go back to the five questions, and then provide a few more observations.
–
1) Where will the GTA average home price go?
We don’t need to re-hash the “who said what” with respect to this metric, since I’ve already burnt that house down a few times.
With the average home price setting a record in June, coming in at $930,710, I was eager to see not only if this record price would hold, but also if it would increase.
Bulls, rejoice.
Bears, find your next excuse…
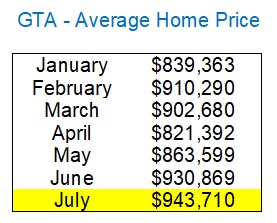
A modest 1.4% gain isn’t much to write home about, although, if you experienced this every month you’d be looking at a 16.8% annualized return, so perhaps this is significant.
Prices did hold, but more importantly, they went up.
Some might suggest that a 1.4% increase in price from June to July is meaningless, but to those, I would provide this chart:

Yep. This could have something to do with the pandemic.
Or?
–
2) Where will the 416 average condo price go?
After I wrote Tuesday’s blog, I had a few very difficult conversations with condo sellers.
I did one price reduction last week, one seller wanted to stay put, and one went dark on me.
For those sellers who are preparing to list in the fall, I’m being brutally honest about the market out there right now, and the following three points will shed some light on where things are.
First, we’ll continue this graphic from Tuesday:
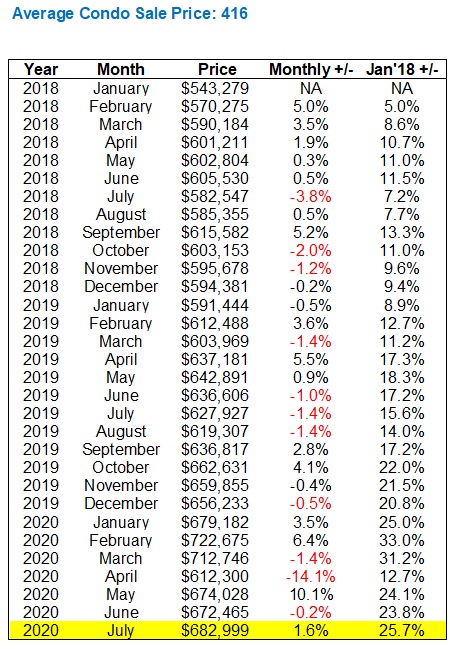
A modest increase from June, which is nice.
But still a way to go in terms of pulling even with pre-pandemic prices.
I actually lost a bid last week for a west-end condo townhouse where there were five offers, and the sale price obliterated the previous record.
The market is spotty out there, to say the least.
–
3) What’s happening with downtown condo inventory?
Tuesday’s blog showed us that inventory is through the roof, whether we’re looking month-over-month or year-over-year.
The trend did not turn course in July, it would seem:
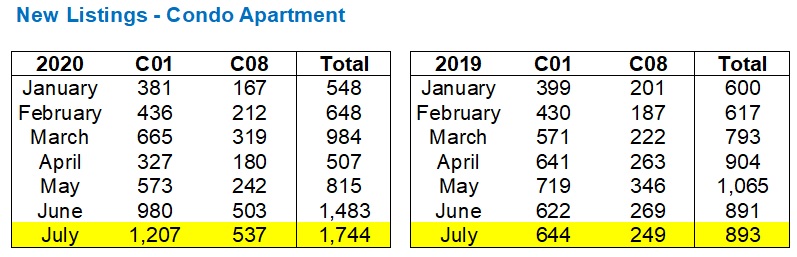
New condo listings in C01 & C08 increased from 1,483 to 1,744 – an increase of 17.6%.
To put this in context, new listings in the same period in 2019 increased by 0.2%, or in absolute terms, by two. Two listings.
The only way this is not a problem is if the number of sales went up by more than 17.6%. More on that in point #4…
As far as the month of July goes, the 1,744 new listings stuck out like a sore thumb:

How about twice as many new listings in 2020 than in 2019? Yikes.
I ran this same state for the month of June in Tuesday’s blog, and it looked something like this, but not quite as overblown in 2020.
–
–
4) What’s happening with downtown condo sales?
Well, believe it or not, sales are up on a relative basis, more than new listings!

From 468 in June to 604 in July – an increase of 29.1%.
That’s more than the 17.6% increase in new listings, so it seems to reason that the “Sales to New Listings” ratio will have tightened, ever-so-slightly.
Here’s how that looks:
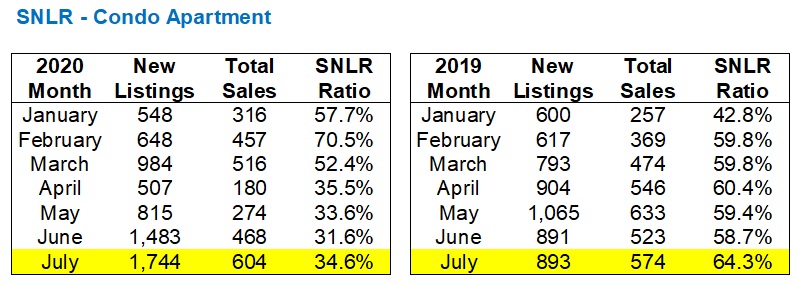
But once again, we can’t really rejoice in that 3.0% uptick in the SNLR from June to July for too long before we look over and see that in July of 2019, the SNLR 5.6%.
It would seem that summer is usually a tight time for condo inventory, I suppose.
Call this a wash, year-over-year, if you want.
I would conclude that the condo market was healthier in July than it was in June. Disagree if you’d like, and please provide your rationale.
–
5) What’s happening with entry-level freehold?
This is very interesting.
And this makes absolutely zero sense to me.
But I can’t have it both ways. I can’t suggest that this one statistic is to be thrown out the window, but all others are to be taken at face value…
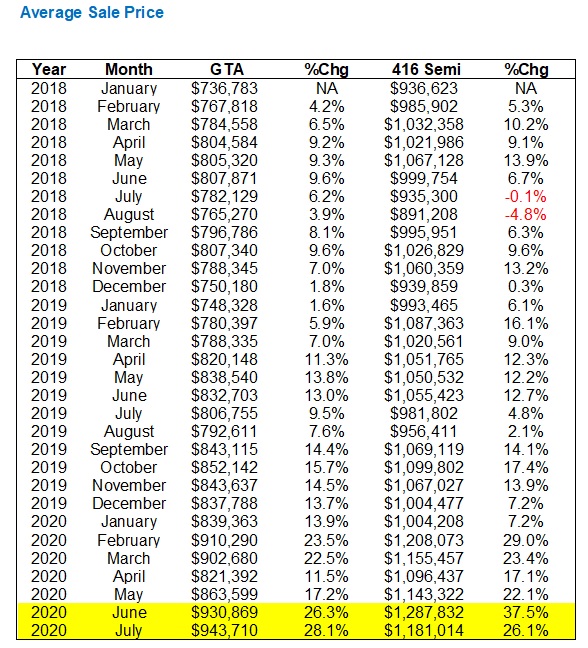
There is absolutely, positively, no way that this makes sense. There’s no way that the average semi-detached price could have gone down by 8.3% from June to July.
Semi-detached prices went up last month, and yet this statistic says the complete opposite.
I had an east-end listing on the market last week. I appraised this for the owner for $1,200,000 in February, hoping to get $1,250,000. Prices dropped through the pandemic in March and April, as we know, and then came back. So when we went to market last month, I was hoping for $1,300,000.
We sold for $1,375,000.
Active buyers and agents who are reading this, tell me I’m wrong – but semi prices did not go down last month in the 416.
I dunno. Maybe a whole slew of $5M semi’s in The Annex sold in June.
I can’t figure this one out.
–
Other observations of note for the month:
1) Average Days On Market
This is a stat we rarely talk about, and for good reason: it’s boring.
It’s also a stat that’s fudged a lot, since agents can terminate a listing that’s been out for 30 days, then re-list, sell it in two days, and it shows up as “2 days on market” in a sale figure.
But on the whole, month-to-month, year-to-year, and apples-to-apples, it holds water.
TREB has come up with two definitions for DOM as of this year:
Average Listing Days on Market (Avg. LDOM) refers to the average number of days sold listings were on the market.
Average Property Days on Market (Avg. PDOM) refers to the average number of days a property was on the market before
selling irrespective of whether the property was listed more than once by the same combination of seller and brokerage during
the original listing contract period.
For the month of July, compared to 2019:
LDOM: –26.1%
ADOM: -24.2%
Properties are selling much faster than in the summer of 2019, and we can all feel it. The numbers agree.
–
2) Detached Is King In The 905
Year-over-year, detached sales in July were up 29.5%, from 8,555 in 2019 to 11,081.
In the 416, detached sales increased by 27.5%.
But detached sales were way, way out ahead in the 905, increasing a whopping 48.3%
How does one explain this?
–
3) Luxury Sales Are Up
It still bothers me that TREB considers the highest price bracket to be $2,000,000+, which is ridiculous since “luxury” should really be $4,000,000 or more, but I digress…
Nevertheless, those $2M sales are up significantly both month-over-month and year-over-year:
July, 2020: 452
June, 2020: 365
+23.8%
July, 2020: 452
July, 2019: 183
+147%
I was speaking with a friend who works in personal finance and investments, and his contention is that the ultra-luxury market isn’t moving. He said, “The Chinese and the Middle East buyers aren’t out there. Nobody’s bidding on $6M houses right now. Without those two subsets of buyers in the market, properties aren’t going to move.”
Looking only at the 416, I found the following data for sales over $4,000,000:
Month-over-Month:
July, 2020: 28 sales
June, 2020: 30 sales
Year-over-Year:
July, 2020: 28 sales
July, 2019: 15 sales
I would therefore conclude that the “luxury” market, whether over $2M or over $4M, is doing well.
–
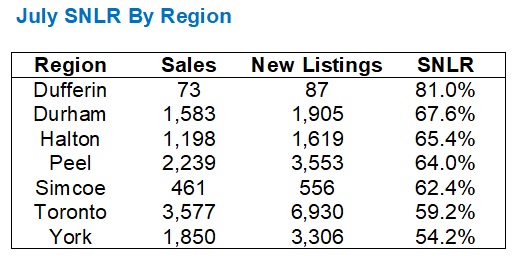
4) Toronto & York Are Trailing
Out of the seven TREB “regions,” would you ever have guessed that the two regions in last and second-last place in terms of SNLR are the two largest?
This was surprising:
–
Well, folks, that was enjoyable for me!
The day that the TREB stats are released is sort of like the day that new PWCC hockey card auctions come alive in the second week of every month, except the former doesn’t cost me any money…
They’re both rather enjoyable, however, in similar ways. Something about the thrill of the chase, and the element of surprise, I suppose.
Any predictions for August, or are we all tuckered out?


Appraiser
at 7:51 am
If the spring market has merely been delayed, as many now believe, then we are due for the usual post-spring summer respite. But it’s nearly fall.
And nothing is normal.
If pent-up demand runs in to the fall market, there is the risk that none of the statistics makes will make sense any more.
…Oh, and the bears will be crying “deferral cliff” until at least Christmas.
Condodweller
at 8:41 am
The downtown condo market is not surprising at all given the large percentage of investment properties and possible rent collection issues. You add in recent rent drops and perhaps the realization that just like prices, rents can’t increase forever, and we have a recipe for investors bailing. There is also an additional incentive to sell condos for a certain group that I don’t want to go into as it would only add fuel to the fire. Despite the fact downtown condo prices are down from the top I think it’s still a healthy situation. Unless there are further declines from here I wouldn’t be too worried. It seems based on the stats that supply is being met by demand for now.
I think it’s funny that David is trolling his own blog by pitting bulls against bears.
I think comparing June/July numbers to previous years’ numbers is silly considering we all agree now that the spring market has been pushed into the summer due to covid, therefore it stands to reason in my book to compare this years summer market to previous year’s spring market. Let’s see how we’re doing by those measures. Yes I fully expect to be labeled a bear again just trying to put a negative spin on things. Fair enough I guess, consider it counter balance to all the positive spin by the bulls.
Appraiser
at 9:19 am
Except your condo analysis is deeply flawed, mainly due to recency bias whereby the condo market was insane prior to Covid-19.
Months Of Inventory is not particularly high by historic standards:
And the inventory is barely covering demand, based on 12-month averages:
The Sales-To-Active-Listings Ratio is still quite high, relative to the past.
https://twitter.com/HannyElsayed/status/1292166918326157312
Chris
at 9:40 am
Meanwhile, condo lease listings printing record highs, while immigration has stalled, students are learning online, AirBnB for these units isn’t happening, WFH seems on the cards until at least early 2021, and lots of completions on their way.
https://twitter.com/BenRabidoux/status/1291077598328639488
Appraiser
at 11:59 am
So what’s your prediction fan-boy?
Rattling off yet another dire word salad doesn’t cut-it.
Chris
at 12:11 pm
Vacant rentals shift to resale market. More supply, less demand.
What’s yours?
Condodweller
at 10:29 am
So my analysis of while prices haven’t fully recovered yet but seems to be doing ok and may improve going forward is flawed and yet you support my thesis with three points. What do you normally say? Incoherent?
J G
at 12:05 pm
Hey Appraiser, why don’t you go buy a downtown investment condo right now? If you think it’s a good opportunity.
Natrx
at 2:39 pm
Have a friend (also realtor) who has 3 condos listed on the market. Primary target was Student market. Said it is dead out there. But very low or no bids. With low rates, people are calm and holding on. Plenty of renters also had been covering their rent via CERB payments. We’ll see how this unfolds in 6 months since any sort of travel/student market seems like it’ll be on hiatus for a long time.
Appraiser
at 3:10 pm
Anecdata is the best!
Thomas
at 9:22 am
The detached market is on fire out there! Every home I was interested in had offer presentation and went way over asking (with at least 10 offers on each). Of course, some of them were deliberately under priced. This is particularly noticeable in the Durham region. I am not sure why Durham is suddenly an attractive option for many buyers. There could be two reasons:- 1. It was undervalued 2. Toronto and York is now out of reach for many buyers. What is obvious is that there is still a LOT of demand! And the craziness is in the 600k – 1.2M price range (at least in Durham). I checked out a pre-con in Pickering on the weekend. They had 42 homes and they sold everything but one on the first day. The prices started at 1.05M but you will looking at 1.2 or 1.3 realistically because they only had one lot at 1.05. To top it, they also have a monthly maintenance fee of $190 (which includes water and sewer) The primary reason to drop it was the fee but I didnt see it as value for money at that price point given that it will be ready only in 2022. But there were 41 others who definitely did not see it that way.
I went through the CMHC report for GTA and for all the vitriol directed at Evan Siddall, the CMHC forecast specific to GTA does NOT forecast a 9 – 18% correction. In fact, I would call it bullish on GTA. Quote from the report:-
“GTA home prices will likely see growth in both 2020 and 2021. Despite anticipated price growth, a continued shift in the composition of sales towards relatively affordable higher density homes will mean a lower average price range. The condominium market, which is currently in sellers’ market territory, will likely experience above average price growth. As a result, areas where these units are common (the City of Toronto and the downtown cores of certain 905 areas) are likely to experience stronger average price growth.”
CMHC is actually bullish on the GTA condo market and yet the data on the condo market so far isnt very bullish. If the majority of the sellers see out this year, the condo market might still turn around and see rise in prices.
I am also looking for answers to these questions:-
1. Who can afford it if the prices continue to rise at the same rate?
2. The effect of the pandemic will be more evident next year and what will happen when the government supports run out?
3. And the most significant one, how far is the government prepared to go with the support measures? This will be more important than anything else!
Bal
at 7:26 pm
I guess people who are bringing money from all over the world…they can afford….lol….i know some of my relatives are selling their properties in India and bringing money too Canada…as they know the next generation won’t be going to India…
Pragma
at 11:57 am
I think there’s a storm on the horizon for downtown condos. I don’t have historical data but it would be great if you could put rental listings in context. I check occasionally and a week ago there were 6000 listing in the downtown area. How does that compare to last year? I just checked right now and that number has risen to 6200. That’s a big jump in a week but I don’t have any context in terms of what is normal. Are rents getting pressured? At what point does an “investor” bail out and just try to capture that equity they’ve built. Over the next 12 months are we on pace for a record number of completions?
Condodweller
at 5:03 pm
For rental the key number you want to watch is the vacancy rates. Latest number I could find is for Mid July at 1.8% which is still quite low even though it’s been rising up from almost 0. If landlords and airbnb hosts are selling they are probably being converted into owner occupied units as it’s had to imagine investors buying at these prices with currently dropping rents. This is likely why prices are lagging other types of homes.
What would be interesting to know is are there renters starting to move into lower priced units or alternatively are landlords are offering price reductions to keep a tenant from leaving. I’m thinking $300-400 a month may be incentive enough to move.
Appraiser
at 12:38 pm
“The Mortgage Stress Test Loosens Up:
Effective this week, it gets a little easier to buy a house or refinance.
On Saturday, BMO and CIBC shaved 15 basis points off their posted 5-year fixed rates. That’s enough to drop the benchmark 5-year posted rate to 4.79%.
Given regulators use this benchmark rate to calculate Canada’s minimum mortgage stress test, today’s cuts mean you’ll now need less income to qualify for a given mortgage amount.”
https://www.ratespy.com/the-mortgage-stress-test-loosens-up-080815253
Bal
at 6:46 pm
Noooooo…..lol…..this news is not good news for me….. Lol
Elle O'lelle
at 1:23 pm
David, a 1.4% monthly return does not = 16.8% annualized. Your business school is going to revoke your degree for forgetting about compound interest.
Jimbo
at 7:46 pm
18.1%, just a rounding error
David Fleming
at 8:29 pm
@ Elle O’Lelle
Too funny. I actually thought hard about whether to simply multiply the 1.4% by 12, or use compound interest, but I wanted the point to be as simple as possible. I guess I thought nobody would notice!