Summer is here, and housing inventory is finally growing! The spring housing inventory was like a zombie rising from the grave, very slow, but the summer is showing some promise and let’s hope it continues. Purchase apps had a small week-to-week gain. Mortgage rates were again in a small range, hanging near 7%.
Here’s a quick rundown of the last week:
- Active inventory grew 8,886 weekly. I am still hoping for some weeks that show inventory growth between 11,000-16,000
- Mortgage rates stayed in a tight range between 6.875%-6.95%
- Purchase application data showed a 2% growth week to week
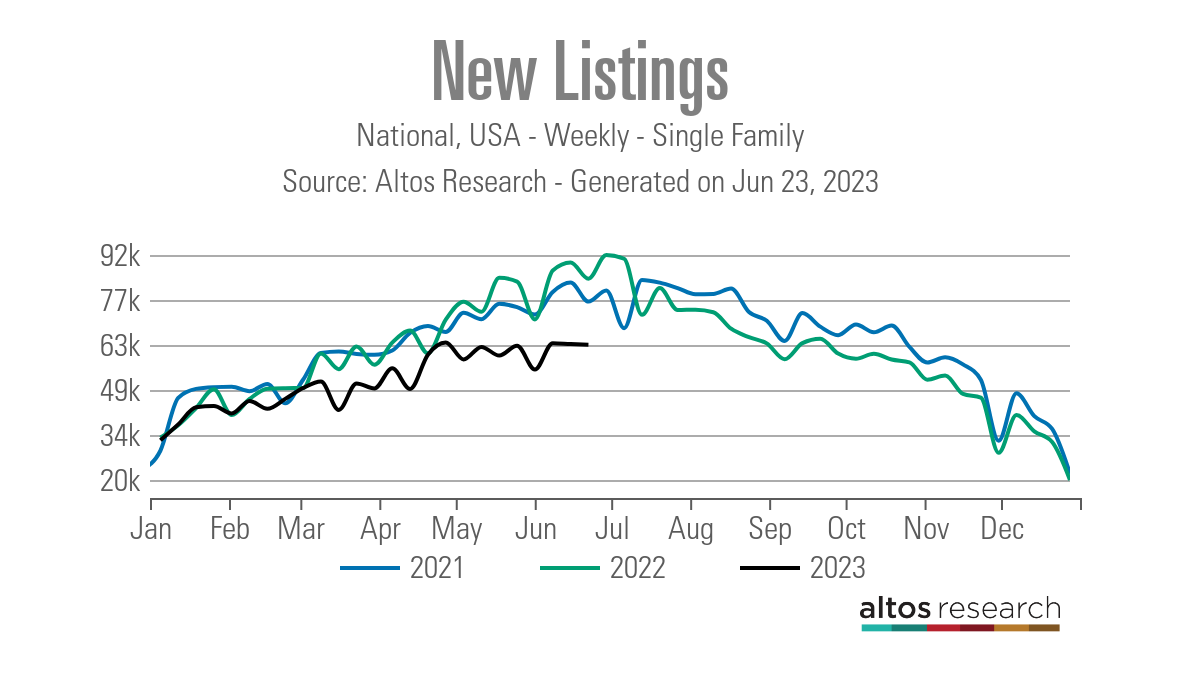
Weekly housing inventory
The active listings data saw decent growth last week, less than I would like to see, but growth nonetheless. I would feel much better about the inventory situation if we added an additional 3,000-8,000 houses to the weekly data line from current levels. However, the real positive story here is that even with new listing data trending at an all-time low, we are getting the growth in active listings we traditionally see in the spring and summer.
- Weekly inventory change (June 16-23): Inventory rose from 451,047 to 459,907
- Same week last year (June 17-24): Inventory rose from 415,582 to 441,106
- The inventory bottom for 2022 was 240,194
- The peak for 2023 so far is 472,680
- For context, active listings for this week in 2015 were 1,179,728
As you can see in the chart below, the inventory growth has been slow this year, and we will have negative year-over-year weekly active inventory data very soon. But, last year saw the biggest home sales crash ever recorded in history, so the rise in inventory last year happened because of an abnormal event and we were working from a very low bar. So, it shouldn’t be a shock that as soon as housing demand just stabilized, we ran into some negative year-over-year data.


In addition, new listing data turned negative year over year after the second half of 2022. The affordability hit with higher mortgage rates has impacted new listings data since most sellers are buyers, thus facilitating an all-time low in new listings data. Also, we must remember that even in 2021, when we had 3% mortgage rates, new listing data was trending at all-time lows.
New listings data has had three weeks in a row of negative weekly data, nothing big, of course, but we are starting to get into the seasonal decline period of this data line. This is something to focus on over the next four to six weeks. The data shows a noticeable decline year over year, and 2021/2022 were already working from all-time lows.
Compare the new listings data this week to that in recent years:
- 2023: 63,106
- 2022: 84,014
- 2021: 76,761
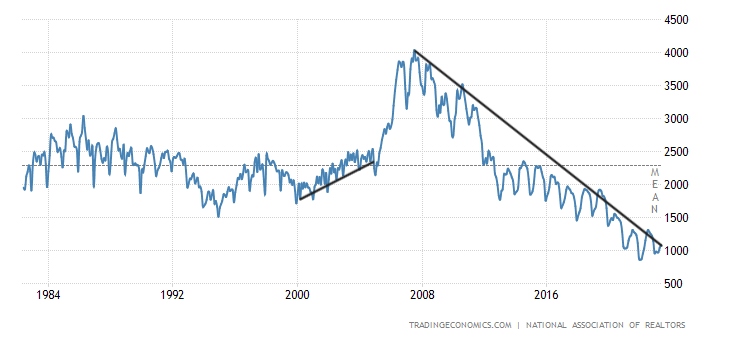
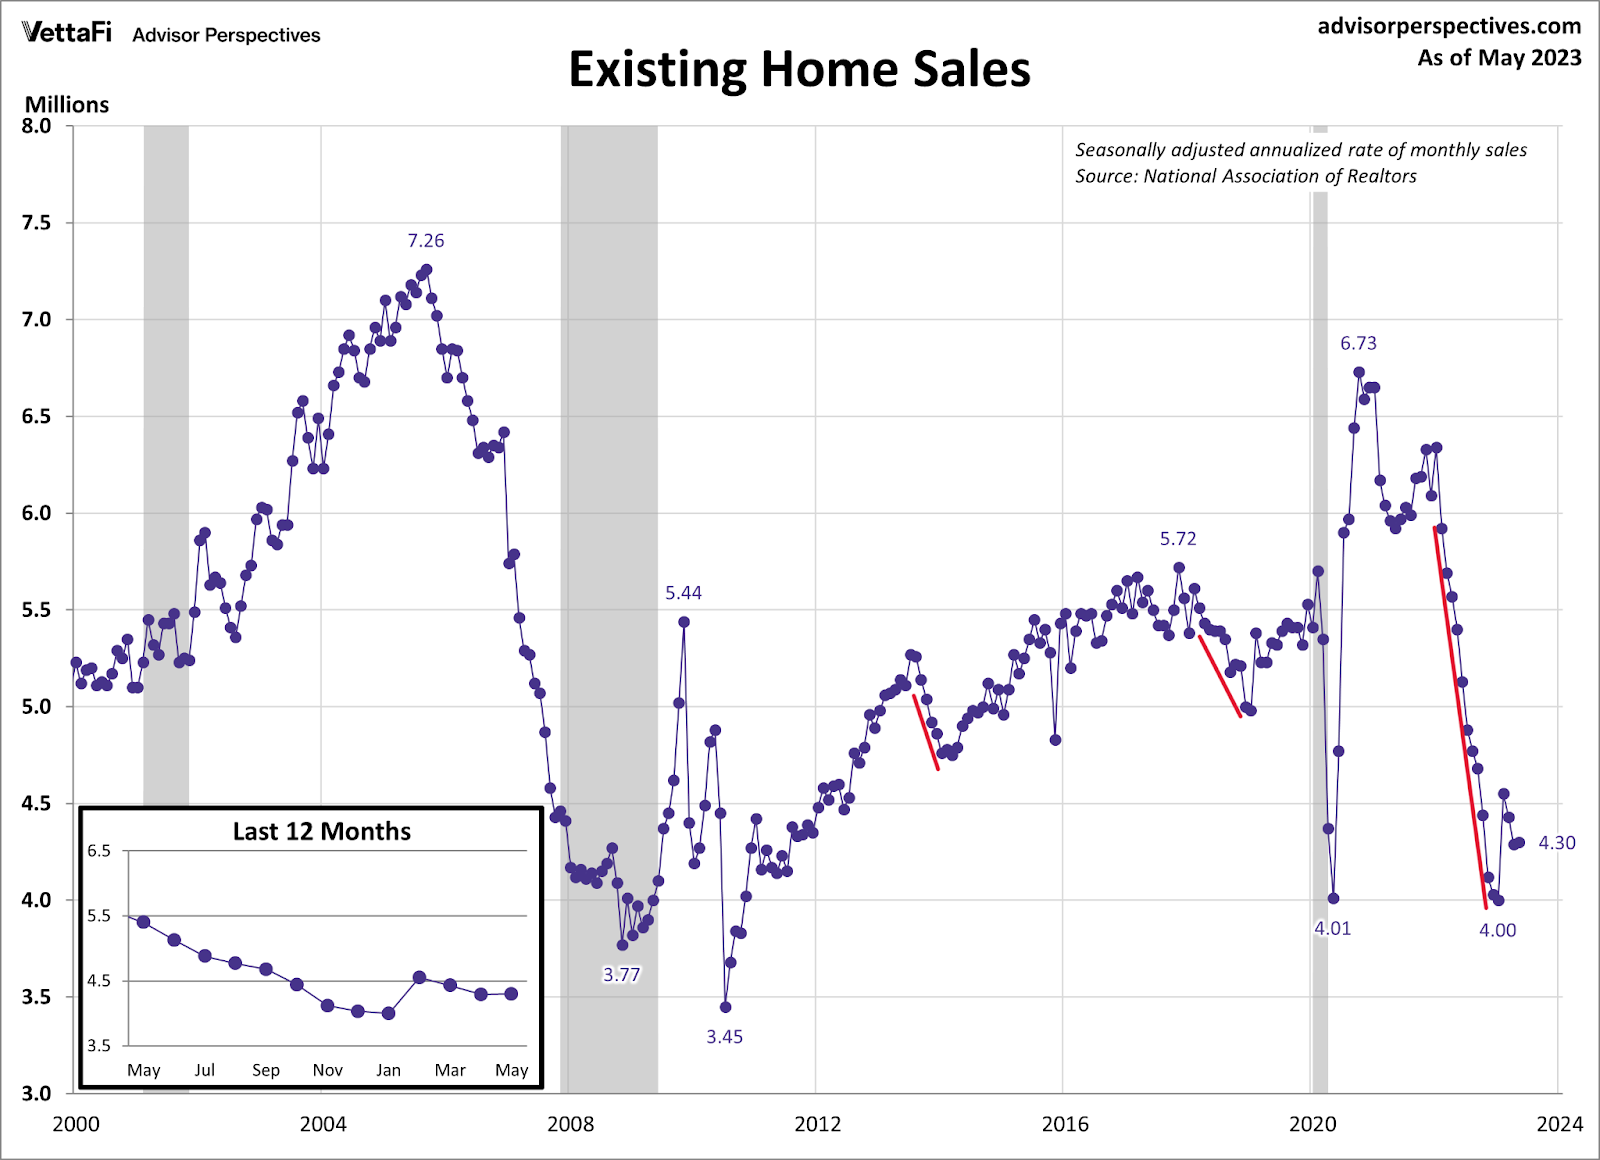
Last week, NAR released the existing home sales report, which showed a slight monthly growth in sales. More importantly, it showed that the days on market dropped back to the teenager level, which means we are once again in a savagely unhealthy housing market. Nothing good is happening in housing when days on market are so low. Also, NAR updated its inventory report showing a year-over-year decline in inventory.
NAR total Inventory levels:
- Historically inventory is between 2-2.5 million
- The peak in 2007 was a bit over 4 million
- Currently we’re at 1.08 million
- Last year at this time it was 1.15 million
People often ask me why there is such a difference between the NAR data versus the Altos Research inventory data. This link explains the difference and is worth a read.
The 10-year yield and mortgage rates
The bond and mortgage rate world has been calm the last two weeks. Considering all the data and Federal Reserve talk we have had recently, it’s surprising how stable rates have been. The 10-year yield had a small range last week, and mortgage rates stayed in a range between 6.875%-6.95%.
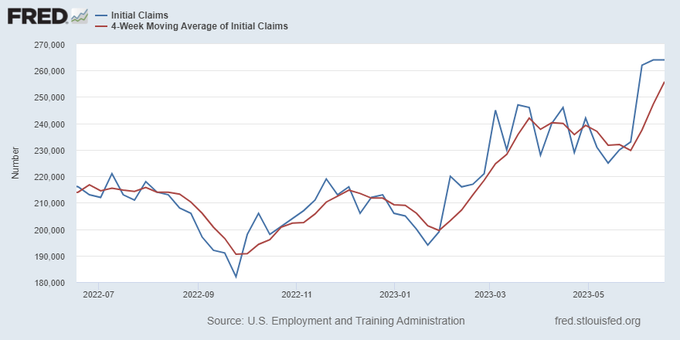
In my 2023 forecast, I wrote that if the economy stays firm, the 10-year yield range should be between 3.21% and 4.25%, equating to mortgage rates between 5.75% and 7.25%. As long as jobless claims trend below 323,000 on the four-week moving average, the labor market stays firm, which means the economy remains healthy. Jobless claims have stayed below this range all year so far and job openings are still at 10 million.

I have also stressed that the 10-year level between 3.37% and 3.42% would be hard to break lower. I call it the Gandalf line in the sand: “You shall not pass.” As you can see in the chart below, we have tested this line many times, and yet the 10-year yield could not pass. The setup for the 10-year yield to stay in the range is intact. Unless the U.S. dollar explodes higher or we get some market stress overseas, we should remain in the forecast range.
The counter to my 10-year yield range would be if the economy here or around the world starts to accelerate higher; that would be a valid premise to get the 10-year yield above 4.25%.
The issue in 2023 is more than the 10-year yield; since the banking crisis started, the spreads between the 10-year yields and 30-year mortgage rates have gotten worse, and until the Fed cries uncle, it doesn’t look like we will see any more improvement.


Another aspect of my 2023 forecast is that if jobless claims break over 323,000 on the four-week moving average, the 10-year yield could break under 3.21% and head toward 2.73%. Last week we didn’t have much movement here with jobless claims, but we have seen the labor market get looser since the lows in 2022.
From the St. Louis Fed: Initial claims for unemployment insurance benefits were little changed in the week ended June 17, at 264,000. The four-week moving average increased to 255,750
Purchase application data
Purchase application data has surprised people with back-to-back positive prints in the last two weeks of 8% and 2%, which means year to date, we have had 12 positive prints versus 11 negative prints. There is no clear direction on demand on the week-to-week data. However, the fact that this is happening is a huge deal, as you can see in the chart below. If this hadn’t happened, all of us would be having a different conversation today about the housing market and inventory.
Since Nov. 9, 2022, we have had 19 positive and 11 negative prints, which shows that demand has stabilized. Now that we are almost to July 4, you can clearly see it in the existing home sales data, as purchase apps are a forward-looking indicator.
Home sales can still trend below 4 million this year if we see more weakness in purchase application data, but the sales decline is much slower this year. This is significant because the market is acting normally again with these low sales levels. This gives everyone a better perspective of where demand is going, as last year’s waterfall collapse was a historic event.

The week ahead: Housing data and PCE inflation
We will have a big week ahead in data. The S&P CoreLogic Case Shiller home price index and the FHFA home price index will come out this week and they will show the firming up the month-to-month price data compared to what we had in the second half of 2022. Also, the new home sales report is coming up, and we will see how much progress we have made.
Pending home sales will be out next week. I don’t expect much to happen there; in fact, we could have a negative report as we did have four straight weeks of negative purchase application data recently.
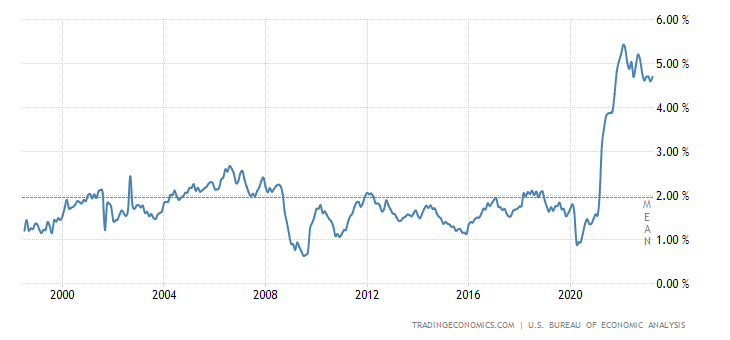
Also, the PCE inflation data will be released Friday — this is where the Fed wants the inflation growth rate to go back down to 2%. I know people love to focus on CPI inflation data, but the PCE data matters more. Below is a look a Core PCE data, which the Fed wants to see go much lower.
So, we have a busy week of data, and of course, we always keep an eye out on jobless claims data every Thursday. However, four housing reports and inflation data with some Fed talk make for an exciting week for bond yields and mortgage rates. Also, we never know what we will get from Russia, with love or without.