
When was the last time you saw a lawn-sign and it had one of those “SOLD OVER ASKING” riders on the top?
I hate those.
I always have.
As a person who crunches numbers as a form of entertainment, I’ve always maintained, “You can make numbers say anything you want.”
I was in a listing presentation in January and the prospective seller asked me, “What is your sale-to-list ratio?”
I explained how that statistic is completely useless.
I explained how the tactic of under-listing had made that statistic antiquated.
I explained how if you took a $1,000,000 house, listed it for $799,900, and sold it for $990,000, then your sale-to-list ratio of 124% could be bragged about, but in actual fact, you did a poor job.
The seller’s response to this?
“Sooooo………what’s your sale-to-list ratio?”
I see agents flaunt their “sale-to-list” ratio as though it has any meaning.
I see agents advertise their average “days on market,” not accounting for that house they had listed for 56 days before they reduced the price, re-listed, and sold after “one day on market.”
I see a lot of nonsense with statistics, but that just makes agents look bad.
The use of these statistics, believe it or not, can help us learn about the market.
Specifically, are houses more or less likely to sell under, at, or over the asking price? This tells us how houses are strategically being priced and listed.
On Thursday, I sat downloaded all the GTA freehold sales data and decided to sort through it and look at sale-to-list ratios, but I also wanted to look at some of the highs and lows with respect to both prices and the sale-to-list ratio.
This is more of a curiosity than anything, but we hear a lot about “average home price” so perhaps we should put this in context by looking at the cheapest sale in each region.
Also – I’m going to show the addresses for these properties because two wrongs do make a right, contrary to what we were told when we were kids. Right now in this city, there are 10,000 real estate agents booking viewings on other agents’ listings, going inside and filming Instagram and Tik Tok videos without the express written consent of the seller, and then posting photos, addresses, prices all over social media…..
….sooo….
The cheapest sale in all of Durham Region, where the average sale price in January was $886,849, was this one:

I don’t believe this house is inhabitable, but it is a house and not vacant land, so technically it counts!
There was another sale of $361,000.
The cheapest sale in all of York Region, where the average sale price in January was $1,285,583, was this one:
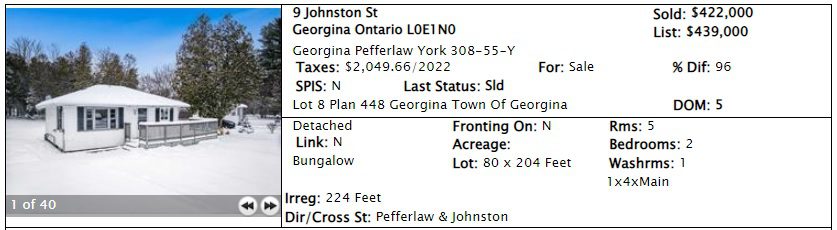
Say what you want about the house, but an 80 x 204 foot lot is impressive no matter where it is!
The cheapest sale in all of Halton Region, where the average sale price in January was $1,122,501, was this one:
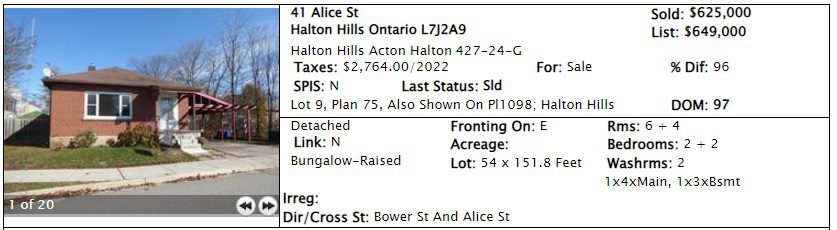
There was only one other sale below $700,000.
The cheapest sale in all of Toronto, where the average sale price in January was $987,842, was this one:

There were also sales of $550,000, $565,000, and $595,786.
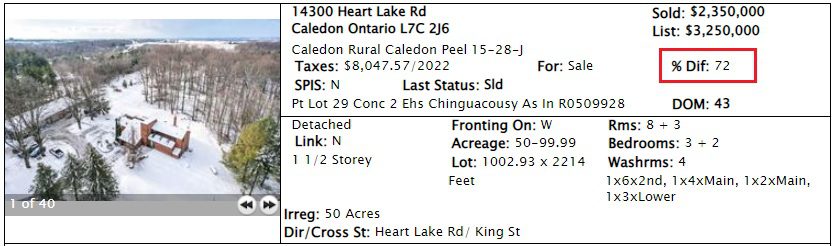
Lastly, the cheapest sale in all of Peel Region, where the average sale price in January was $993,151, was this one:

There was one other sale below $700,000.
Now, in terms of sale-to-list ratios, there are a lot of statistics here so for those who were tired out by the Monday/Wednesday, blog, my apologies!
Let’s start with Durham Region.
Perhaps surprisingly, Durham Region saw the highest percentage of sales over the asking price with 35.7%.
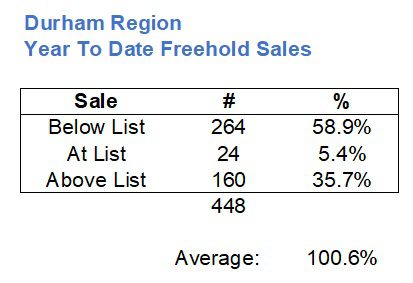
Durham also saw the lowest percentage below list with 58.9%, but all five areas saw the inverse for above/below.
The 100.6% sale-to-list ratio overall was second only to York.
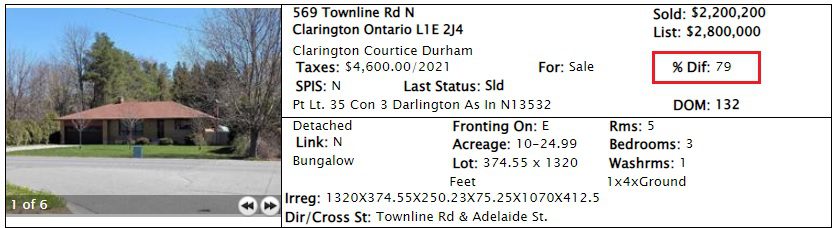
The lowest sale-to-list ratio in Durham Region?
This one here which sold almost $600,000 under list:
–
York Region saw the second-highest percentage of sales above asking at 34.7%:
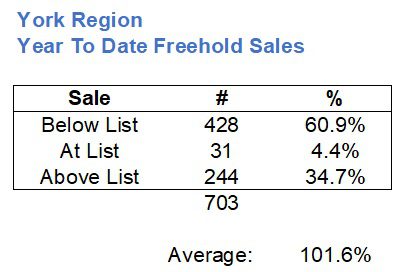
As noted, this means York Region saw the second-lowest number of sales below listing at 60.9%.
York Region saw the highest overall sale-to-list ratio at 101.6%.
Here’s the sale with the lowest sale-to-list ratio at 77%:

–
Halton Region saw a ridiculous 80.7% of sales below the list price:
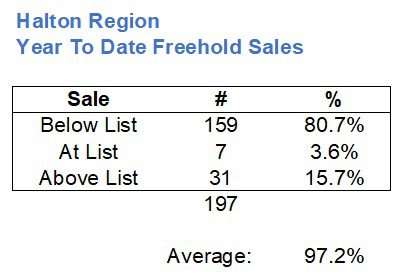
The 15.7% above the list price is the least of the five TRREB regions.
The 97.2% sale-to-list ratio overall is also the least of the five TRREB regions.
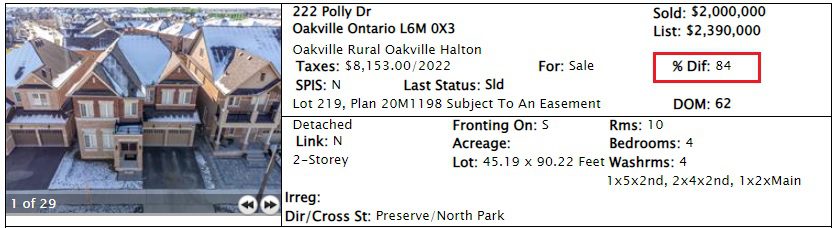
The smallest sale-to-list ratio this year in Halton wasn’t that terrible: 84%…
–
Toronto was right in the middle, 3rd place, for both above-list sales and below-list sales:

Toronto was also in the middle, 3rd place, with the 100.4% overall sale-to-list ratio.
The house with the lowest sale-to-list ratio?
You’ve already seen this one above, as it’s also the cheapest house to sell in Toronto this year:

–
Last, but not least, Peel Region:
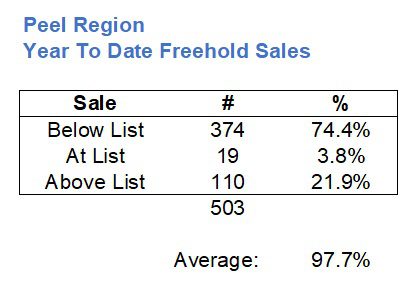
Peel Region saw the second-highest percentage of sales below list and thus the second-lowest percentage of sales above list.
The 97.7% overall sale-to-list ratio is second-worst.
But Peel has the property with the lowest sale-to-list ratio of all five TRREB regions, this one here at an incredible 72%:
–
I’m not going to repeat the exercise for the properties in each region with the highest sale-to-list ratio, but here’s the one property in all five regions that takes the cake:
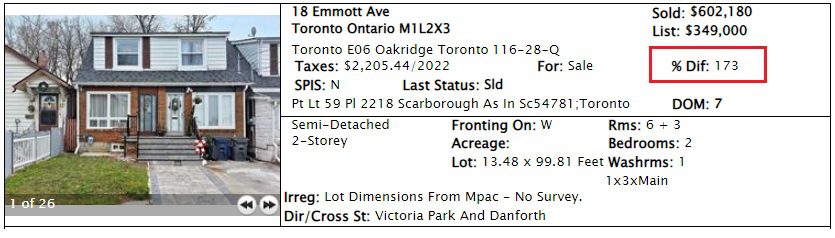
173% of the list price, wow!
Then again, if you list a house in Toronto for $349,000, what do you expect?
That’s a wrap for this week, folks!
Have a great weekend, everybody!


Sam
at 9:29 am
Frank Leo still advertising “sold over asking” on Fan590 every morning and evening during my commute!
Ace Goodheart
at 12:25 pm
Ahhh, the inevitable and ongoing argument on the topic of list price versus sale price.
Evil Realtors deliberately under listing houses, to achieve bidding wars and high sale prices.
Or listing at the wrong price, for the wrong reasons. Or listing at $1.00 when the seller has no intention of selling for $1.00.
The debate rages.
Personally, I could care less. You embark on the pricing strategy that you believe meets your needs. I have done both, listed at the price I actually wanted, and under priced deliberately to create interest and get multiple offers. People complained about both strategies when I did them.
I was like “I don’t care, it’s my house and I’ll sell it however I want to”.
Vancouver Keith
at 11:47 am
I can’t believe you can buy that much land in Toronto for 540k. Vancouver would be double that in any neighborhood.