
I read an article by CBC News the other day that drew a link between our competitive rental market and people’s mental health.
I suppose it was just a matter of time before this headline appeared:
“Toronto’s Pressurized Rental Market Is Affecting People’s Mental Health.”
You know I always read the comments, not because they’re necessarily intelligent, relevant, or accurate, but because I like to know what the masses are thinking.
Here’s the very first comment:
Why is it, in the last 20 yrs pretty much anything and everything that is perceived to be negative ends up having stories written about it as having negative impacts on some peoples mental health.
Is it actually mental stability that is being impacted, or is it a product of social changes where we have stopped teaching people how to deal with adversity.
Good question!
And one that I’m not volunteering to answer today…
The rental market in Toronto has been just as much, if not more of a hot topic this year than the resale housing market, and for good reason.
Prices are up, no doubt about it.
According to Rentals.ca:
Average 1-bedroom Toronto rental up 1.1% month-over-month, up 10.5% year-over-year, to $2,620.
Average 2-bedroom Toronto rental up 1.3% month-over-month, up 7.1% year-over-year, to $3,413.
Imagine the average rent for a 1-bedroom being $2,620? That’s crazy!
Now, my cynical side looks at the price for a 2-bedroom and says, “Half of that is just over $1,700 per month, so why not find a roommate and reduce the cost of living?”
But my more cynical side answers and says, “Because people want what they want.”
Prices increase partially due to inflation every year and that should come as no surprise. But the price of new condo rentals increases because of the cost of acquisition, which increases because of the cost of construction, which increases for many reasons.
Prices also increase because of the relationship between supply and demand, and it’s that relationship that we explore every quarter in this TRB feature.
Can you believe it’s been three months already?
The last time we were in this space, the summer was just underway! And the next time we find ourselves in this space, we’ll be into 2024. I shudder to think…
So with Q3 in the books, let’s take a look at new lease listings, which as always, refers to condominiums in the C01 and C08 TRREB areas:
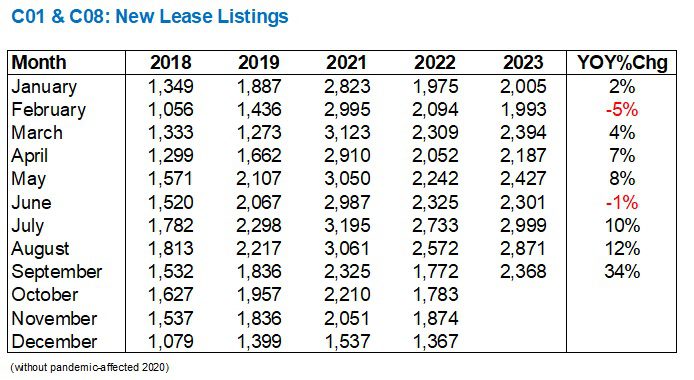
What a difference a quarter can make!
Back in June, we were looking at a year-over-year decline in new listings, albeit only 1%, but even if we look back to Q1, we can see the trend was toward a market that closely traced the previous year.
Two of the six months saw less inventory, with -1% and -5%, and the four months that were in the black were still below double-digit.
Fast forward to the summer and we saw increases of 10%, 12%, and 34%.
What happened?
Look how much larger these figures are over 2018, as an example.
Is this simply the result of more condominiums having been built and offered for lease?
Or is there just more turnover?
Here’s the data graphically, which we’ll come back to in a moment:
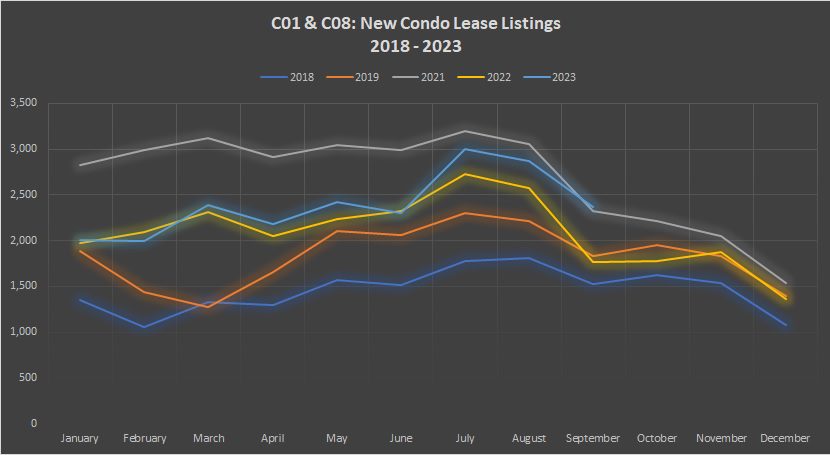
Perhaps the graph better demonstrates the increase in inventory throughout the entire year.
Each month of 2023 has done no worse than second-place, and as we see in September, we’re now at the highest point.
Listings typically taper off in the fourth quarter, but I’ll be watching to see if we’re still at all-time high inventory levels.
Now, if we’re seeing dramatic increases in listings, should we expect to see a dramatic increase in leases as well?
I would hope so! Otherwise, the absorption rate declines, and inventory begins to sit.
Then again, those who lament that the rental market is difficult and often torturous will be all-too-pleased to see a level of lease activity that significantly trails new listings.
Let’s have a look:

It seems as though, throughout 2023, the theme here has been an overall decline in leasing activity.
For the third quarter, consider that we saw year-over-year inventory increases of 10%, 12%, and 34%.
But in the same period, we only saw leased units only increase by 10%, 8%, and then a decline of 6%.
Keep that last number in mind, because it’s going to put an interesting number on the board when we get to the absorption rate.
Here’s the data graphically:
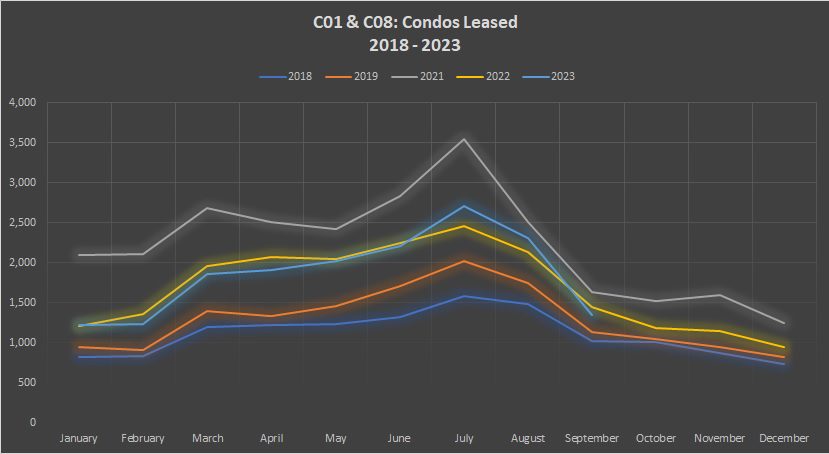
While July and August saw the second-most condos leased in the five-year period we’re analyzing, September only saw the third-most.
The relationship between new listings and leased unitd changed dramatically in September, and that could have a significant effect on the market.
This becomes very clear when we look at the absorption rate:
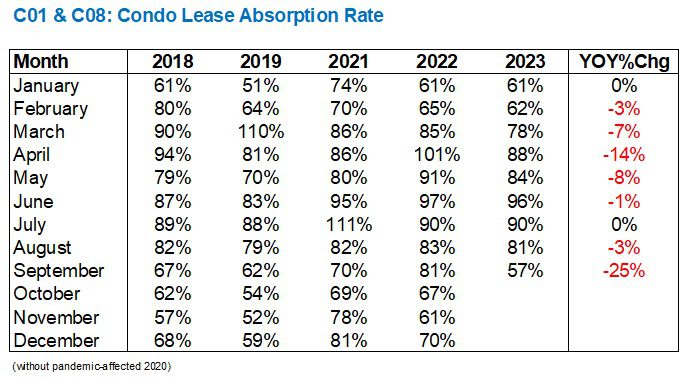
Through nine months in 2023, the year-over-year absorption rate has declined in seven of those months and remained flat in two of those months.
This is the complete opposite of what every media article about “renting in Toronto” is telling us.
We consistently hear about how hard the rental market is to break into, and while I’m certainly not saying it’s easy, I would suggest that it’s not getting any more difficult.
At least, the numbers aren’t telling us that.
Consider a 57% absorption rate in September.
Doesn’t that stick out like a sore thumb?
Examined monthly, we go from a trendline of 88%, to 84%, to 96%, to 81%, which all seams reasonable, until suddenly we drop to 57%.
Examined yearly, the previous four years show 67%, 62%, 70%, and 81%. Nothing close to 57%.
Now, if we want to look at expectations, consider that the August-to-September decline in the previous four years was 15%, 17%, 12%, and 2%. And yet we saw a 24% decline in absorption rate – from 81% to 57%, in the August-to-September shuffle.
This is very hard to ignore.
It’s even harder to ignore when we view it graphically:
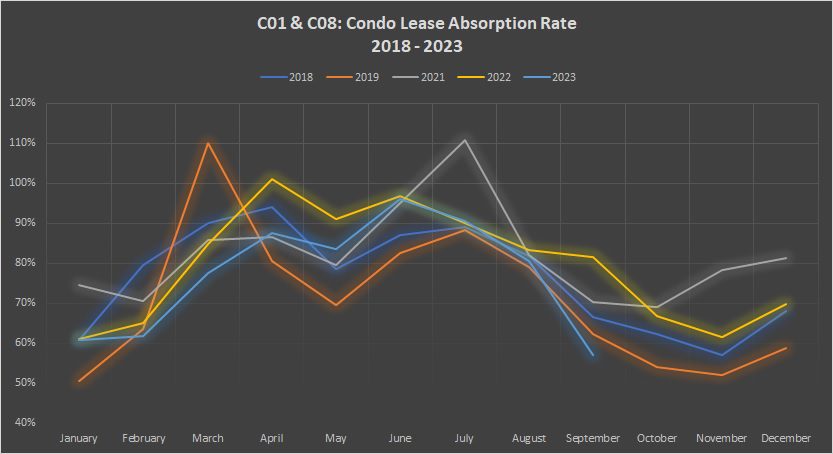
First, you’ll notice the light-blue line dips lower than all the others in September.
Yes, we established that the 57% absorption rate is the lowest.
But you will also notice that, from January through August, the 2023-line was mixed in with the rest. Sure, it was at a low-point in February and March, but for five months thereafter, there was nothing unordinary about the absorption rate.
Now, I can’t help but wonder there this 57% figure takes the market.
I don’t expect rental prices to come down, but at the same time, I have to wonder how this doesn’t affect the market in some way.
More choice for renters?
More ‘days on market’ and a slower and more manageable pace and process?
Less competition?
I could see all three of those scenarios playing out in Q4 but I just don’t see rents declining.
We’ll see if that holds true when we meet again in this space after we’ve taken down the Christmas lights…


Jimbo
at 10:17 am
Very interesting considering how many students take possession Sept 1st vice Aug 15th or 1st
QuietBard
at 12:36 pm
I think reading the June condo report plus other articles at the time showed how dire the rental market was. But looking at the data it seems that its just a seasonal event. There is no worse time to rent a new apartment in July and the best time might be in December. Maybe people that have the flexibility should avoid july and try to find accommodations another time of the year?
As for the original question, I think there are 2 types of stress (gross oversimplification). 1 is the everyday or once a year type of event that ranges from inconvenient to this really hurts maybe I should change some things in my life to avoid this. 2 is the extremely traumatic stuff that just haunts a person and doesnt really go away by itself (war veteran suffering from PTSD for example). We seem to be in a world the 2 have become so mixed that getting the wrong drink at starbucks “triggers” some folk. Which, honestly, for an $8 latte kinda makes sense, but also doesnt.