
My wife and I have a very good and very well-understood and agreed-upon division of labour in our household.
I hope your mind doesn’t automatically go to “pink jobs” and “blue jobs” when you hear this, or that you assume I’m running my family like a quaint 1950’s household.
Yes, I’m the one who takes out the garbage, and yes, my wife primarily handles cooking. But I’m the laundry-folder, the sole dishwasher-unloader, and I’m the one who gets up in the middle of the night when the kids cry out.
So no, we’re not Dom Draper and Betty Draper, however, there’s one job that my wife has handled exclusively for the last six years, and that’s placing the ‘Elf on A Shelf’ in a different place in the house every night in December.
Elf on A Shelf.
Damn, whoever thought of this stupid thing made an absolute killing.
Our elf, affectionately named “Stainey” by my daughter years ago, makes her first appearance every year once our Christmas tree is up. She’s always found atop the tree on the first morning, and after that, she appears in a new place in the house, every single morning, along with a note for Duke and Maya.
I have never placed Stainey. It’s just something my wife always handles.
That is, until this year, when my wife went to bed one night and texted me to say, “I forgot to move Stainey. Can you please grab one of the notes from the folder, and move Stainey somewhere?”
So I did.
In fact, I found the best possible spot for Stainey! Better than any previous spot!
I placed Stainey on the light fixture in my home office, with her arms wrapped around one of the Edison bulbs, and then I placed one of the notes (FYI – you can buy a whole month’s worth of these with your kids’ names on them…) on my desk under the light fixtures.
And all was well!
Maya and Duke found Stainey in my office the next morning, they read the note – which had a recipe for shortbread cookies, and we all went on with our days.
But that night, my wife again asked me, “Hey, can you please find another place for Stainey?”
And here’s where things went a bit off the rails…
So, remember how I said that I placed Stainey on the light fixture with her arms wrapped around the Edison bulb?
Yeah, um, about that.
You see, Stainey is made primarily of plastic, and evidently, light bulbs are hot.
So when I took Stainey down, she was kind of…..um…..well…..missing something…
….her face.
Yeah. Oops!
Stainey’s face had melted off. Completely.
I’m talking John Travolta and Nicolas Cage in Face/Off.
I’m talking about that poor security guard in Silence of The Lambs.
I’m talking about Pete Davidson in The Suicide Squad.
I’m talking about Marvin. Poor Marvin. Brownie points if you can name the movie reference here.
In any event, I was forced to place Stainey strategically for the next morning: up high, back-facing-out, clutching a bottle of Fantastik on the shelf in the laundry room. Then thanks to Amazon, we had a new Stainey delivered the next day.
Well, what can I say?
I’m good at some things and not others.
For example, I’m not good at relaxing. I try, but I’m usually unsuccessful.
We flew home from London, England after a short visit with our family, and I was up the next day at 5:00am, downtown to be on CTV Your Morning at 7:00am, and then at the office by 7:45am. And this is on January 2nd with virtually nothing to do in the world of real estate!
I’m also not good with change.
So put those two things together, and I’m finding it really, really hard to wrap my head around this business of “only” blogging twice per week.
I had so many ideas over the holidays but I told myself on Christmas Eve: “You’re going to relax. You’re not going to work.”
So I didn’t.
I didn’t write a single blog for two weeks!
And that didn’t relax me; it stressed me out!
Not only that, I have so much to discuss with you all, and I wonder how I can do it in only two blogs per week.
Then how do I “waste” a blog day with something like “Which Colour Brick Home Do You Like The Most?” or, God forbid, “More MLS Musings?”
And as a reader pointed out on the final blog of 2023, what becomes of the “Friday Rant” if I’m only posting on Monday and Thursday?
Gosh, just thinking about this makes me want to burn my face on a hot lightbulb…
So here we are in 2024, “new year, new me,” as far, far too many people told themselves (and others…) after January 1st last week, and I’m going to try to pack all of my real estate thoughts, opinions, perspectives, observations, objections, and frustrations into two mere posts per week.
Keep in mind, that I do produce a weekly video every Thursday called “Pick5” and have been doing so since since 2013.
And I do produce a monthly “Market Update eNewsletter” which a client recently told me is “like an extra blog post per month.”
We’re not quite ready for the new podcast or Youtube video series, but that’s right around the corner.
So here we go!
How do we start 2024?
Well, perhaps by being unoriginal? Or if you’re an optimist, and you enjoy what we do here on TRB, you could say that I’m being “predictable yet informative?”
In January of 2023, it was the “Top Ten Topics of Discussion For 2023.”
In January of 2022, it was the “Burning Questions For 2022.”
In January of 2021, it was the “Top Ten: Burning Questions For 2021.”
In January of 2020, it was the “Real Estate Discussion Points For 2020”
In January of 2019, it was the “Top-Ten Burning Questions For The 2019 Real Estate Market”
I shudder to search back any further. In fact, I already feel like I’m in great need of a thesaurus…
Question. Quandry. Conundrum.
Burning Question. Pressing Question. Hot-Button Issue. Vexing Problem.
I suppose if we want to boil this down to the most basic level, we’re really talking about what’s on our minds – specifically our real estate minds. While that’s not grammatically satisfying, it’s direct, simple, it’s honest.
Our “Top Stories” from 2023 was all-encompassing. Each topic, ie. “The Future Of Housing In Toronto,” came with multiple angles and run-offs.
But as we sit here at the start of 2024, I would prefer to simplify things.
Many of these topics will be nothing new, but they will be the topics at the forefront of our real estate minds…
1) Prices
As I said: nothing new.
We talk about real estate prices all the time!
But there’s absolutely no doubt in my mind that this topic will dominate 2024 because every other topic comes right back to the starting point, with respect to price.
In our “Top Five Stories” in December, #2 on the list was pricing. Not prices, but pricing. We discussed, at great length, how the real estate market in 2023 was so unpredictable, with so much change, and with so much denial among both buyers and sellers, that pricing was all over the place.
Pricing “strategies” were often anything but. Sellers refused to accept market conditions, buyers refused to pay a premium and often wanted to price in future price declines, and the result was a stalemate that the trench-goers of World War I would be envious of.
But despite the multitude of topics that we explore on TRB or that people discuss at the proverbial water-cooler, those both in and out of the real estate market have always and will always be concerned with prices first and foremost.
We’ve been quite spoiled all these years, haven’t we?
Here’s an up-to-date chart of the average Toronto real estate price in Toronto, from 2002 through 2023, by month:

Yeah, pretty spoiled!
While the 2008 downturn has been mostly removed from the long-term chart, as prices have risen so greatly since then, the 2017 and 2022 downturns are still quite visible.
But hyper-appreciation often leads to a subsequent decline, and perhaps 2017 and 2022 will be lessons moving forward for the next bull run that leads to a 20% increase in four months, say, in 2027.
We spent a good deal of time in 2023 talking about sellers who wanted to sell – in 2023, for a 2022 price.
Some eventually accepted market conditions while others decided to hold off. And as you’ll read in the next section, that resulted in sales data that was absolutely mind-boggling.
So what’s on everybody’s real estate mind in 2024 is this: where are prices going?
There has been no shortage of predictions made over the last few weeks.
Royal Lepage forecasted a 6% increase in the average home price in the GTA by the end of 2024.
Re/Max forecasted a 3% decrease in the average home price in the GTA for 2024.
Huh?
Really?
And now, may we please hear from Keller Williams, HomeLife, and maybe even EXP Realty?
But what figures are we working with?
Here on TRB, we often look at the current average home price, ie. the monthly price.
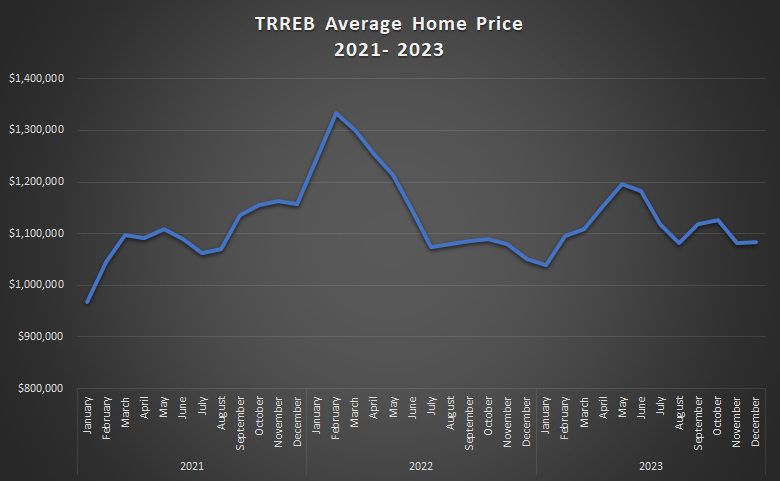
Some of you know this chart off-by-heart, but as a refresher, let’s take a quick look at the last three years, since it encompasses the run-up to the peak the decline, and the comeback trail that we find ourselves on now:

The peak was in February of 2022.
The trough was in January of 2023.
And the average home price in December actually increased over November, which had only previously happened once since 2002.
So if we show the above data graphically, we really underscore what happened with this “peak” in February of 2022:
Years from now, I’ll still be telling stories of February of 2022. In fact, I already do.
But I truly believe – and you can tell me I’m full of crap if you want to, that much of the lost ground from that 2022-peak would have been regained last year if not for the resistance to change.
Change is hard to enact, hard to comprehend, and often hard to accept.
As I wrote in my January eNewsletter that many of you received, when I look back at the 2023 real estate market, I can conclude with absolute confidence that the market took its shape primarily because of the aversion to change.
Just consider this scenario for a moment:
You’re in the market for your first home. You and your partner are expecting your first child. And excited as you may be, you simply can’t get over the fact that your 5-year, fixed rate mortgage pre-approval comes with an interest rate of 5.49%. Why can’t you accept this? Because your cubicle-mate at work talks about her 2.69% rate and your boss won’t shut up about being in the third year of his – wait for it – 1.49% rate.
Change is hard to accept.
And in 2023, both buyers and sellers alike just simply couldn’t wrap their heads around the change in the market.
Consider this scenario too:
You’re looking to sell your home. You’ve been waiting to downsize and the time is finally right. But as excited as you may be, you simply can’t get over the fact that your neighbour sold in February of 2022 for $1,700,000 and now your real estate agent is saying you can “only” get $1,550,000 for your house. The fact that you bought for $422,000 in 1998 doesn’t matter.
I hate to use the word “should” here, but the market should have been busier in 2023 and prices should have recovered more than they did.
But we’re looking at the monthly average Toronto home price, as we always do, and TRREB has a yearly average home price that I believe most of the brokerage and media predictions are being based off of.
The yearly average home price is simply an average of every single property sold within the year. We’re not averaging the monthly prices, but rather if there are 100,000 sales total, we’re taking the average of those.
2023’s average home price came in at $1,126,604.
2022’s average home price was $1,190,749.
That’s a decline of 5.4%.
A decline of only 5.4%, and I’ll tell you why that’s important in the next section.
But the “decline from the peak” looks a heck of a lot worse if we’re using monthly data.
The average home price in February of 2022 was a whopping $1,334,554.
If you take the average home price from December of 2023, or $1,084,692, you would conclude:
The “market” is down 18.7%.
But it’s not. That’s not a fair account and it’s cherry-picking numbers.
If you’re a person who bought in February of 2022 and sold in December of 2023, I still don’t think these figures are applicable to you.
Sample size is important in an overall context, and while we spend a lot of time on TRB looking at these monthly figures, it’s because we meet here on TRB three times per week, every week, every month, all year. But the Royal LePage and Re/Max predictions are based on these yearly TRREB figures, so I owe you that context at this juncture to put them in perspective:

This looks similar to the monthly chart but there’s only one data point per year instead of twelve, and thus the curve is smoother.
The point that might be lost is this: the average home price increased on a year-over-year basis every year from 1997 through 2017.
In 2018, the average home price declined from $822,510 the prior year to $787,842; a decline of 4.2%. That year, 2018 marked the first year that prices had declined since 1996.
But this perspective is only possible if we use that yearly TRREB data instead of our typical monthly figures.
Those predictions, prognostications, forecasts, and outlooks are based on the yearly figures, and as we saw above, Royal Lepage predicted a 6% increase while Re/Max predicted a 3% decrease.
For the record, an increase of 6% on the $1,126,604 figure posted in 2023 would result in an average sale price of $1,194,200.
That’s significant.
Why?
Well, because it would be a new record. The previous yearly high was $1,190,749 from 2022.
I know that it might be confusing to see “new record” and $1,190,749″ together, since many of us (myself included) have that $1,334,554 price from February of 2022 engraved in our brain. But that was the average sale price in one month. If we want to compare by decades, and if we want to use yearly forecasts, then this data is more relevant.
So at the risk of posting the tallest chart of all time, not to mention making it difficult for some of you to read on your phones, let’s look at the average GTA home price from 1978, when TRREB started tracking this data, to current. This is impressive, trust me!

Where you want to start?
I mentioned that the year-over-year price increased for twenty-one straight years, 1997 through 2017.
But what about the fact that in a forty-two year period, the average home price has increased thirty-three times?
Now, if we really want to use this data to make a forecast about 2024, then how about this hot take:
The last time we saw a year-over-year drop was in 2018 when the average home price dropped 4.2%. But after that, the average home price increased by 4.0%, 13.5%, 17.8%, and 8.7% in the next four years.
That’s a 51% increase over four years.
Should we expect the same thing to happen this time around as well?
No, probably not.
But I do believe that the average home price will increase this year, and by that I mean the 2024 total average home price will be higher than $1,126,604.
As for those monthly prices that we track so dearly, that’s another story.
December’s price was $1,084,692, well off the 2023-high of $1,196,101 in May.
I do believe that we will surpass $1,200,000 as a monthly high in 2024 at some point, and if I had to predict the month, I would think April or May.
I expect the January average home price to be over $1,100,000 with relative ease, although the sales data will wane.
Sales. Huh. That’s also on my real estate mind…
2) Sales & Inventory
I can admit when I’m a little bit jealous.
It happens to all of us, right?
Sometimes, another real estate agent gets a great television spot and I get upset because I would have answered the questions better (and probably found a way to blame the government for high taxation in the process…), then other times, another real estate agent sells a property with a sly bully offer before I could even show the property to my clients!
But what really gets to me is when the media releases a story after I’ve already tried to draw attention to it.
“Toronto Just Saw The Worst Year For Home Sales In 23 Years”
Toronto Star
January 4th, 2024
Okay, but I wrote about this on December 19th.
Sure, it’s only the difference of sixteen days, but I wrote about this before the Toronto Regional Real Estate Board released their year-end statistics.
Not only that, I wrote about the story of “all-time low sales” throughout 2023.
Sales in 2023 were absolutely abysmal, and it was quite clear from the onset.
There were only 3,100 sales in January of 2023, and that was the second-lowest since I started tracking this data in 2002.
The 4,783 sales in February were the second-lowest as well.
March and April saw the third-lowest, May was our best month of the year – only having the sixth-lowest, but by the fall, we saw the fewest sales ever in August, September, and October.
In a year-end blog post, I was able to estimate a yearly total by taking the total from January through November and using the previous year’s total for December.
The result?
The lowest sales ever.
Well, since 2002.
And because I was asked by a friend, “Why do you only go back to 2002?” it’s because the TRREB tracking metrics changed in that year, and we don’t have public-facing data for prior years, even though the archive goes back to 1996.
Regardless, we saw a mere 65,982 sales in 2023, which is the lowest since I started tracking data in 2002, and according to TRREB, the lowest overall since the year 2000.
Let’s put this data in context by looking at yearly sales from 2002 through 2023:

That’s absolutely shocking.
Let’s use historical context to put these numbers into perspective.
Which of the following does the best job:
1) Those 65,982 sales are only 54.0% of the record 122,133 sales recorded in 2021, or another way of saying this is that sales dropped by almost half – 46.0%.
2) Those 65,982 sales are over 8,000 lower than the next-lowest figure of 74,107 which was recorded twenty-one years prior.
3) Those 65,982 sales are 26.6% lower than the average of 89,837 sales recorded each year between 2002 and 2022.
Wow, it’s like trying to choose your favourite child.
But for me, it’s #2.
Why?
Well, because while producing fewer sales than the 74,107 recorded in 2002 is pretty poor on its own, just think of how many fewer homes actually existed in 2002!
Just as we would “adjust for inflation” when comparing prices, maybe we can adjust for growth by looking at the difference between population and housing from 2002 to 2023?
According to macrotrends.com, the approximate number of people living in Toronto in 2002 was 4,777,000 compared to 6,372,000 in 2023.
2.5 people per dwelling is a long-accepted metric for housing in Toronto, so we could estimate there were 638,000 fewer homes in the GTA in 2002.
This might be back-of-the-napkin math here, but that’s a sale rate of 3.87% in 2002 compared to 2.59% in 2023.
Or putting this another way, those 74,107 sales in 2002, adjusting for growth in population and housing, would comparatively represent about 98,850 sales today.
That’s absolutely shocking.
To be fair, the fourth-lowest total was from 2022. But then again, the highest was in 2021.
So can we conclude that 2023 was a “bad market?”
It really depends on perspective.
On the one hand, we saw the fewest sales since 2001, and a 46% drop from the peak in 2021.
On the other hand, we saw the fewest sales since 2001, and a 46% drop from the peak in 2021, and the average sale price only dropped by 5.4%.
If you looked at any product or service where sales were essentially the lowest ever, adjusted for population growth, you’d expect prices to plummet, if not for that company to go broke.
But prices only moved 5.4%. Incredible.
So the other side of the sales coin is always inventory, and what’s on my “real estate mind” is how much is going to be listed in 2024.
First, just exactly how much was listed in 2023?
This much, historically speaking:

Alright, so not the lowest to match the corresponding number of sales, but among the bottom handful of years.
Then again, there’s not as much variation between
New listings for 2023 are off 21.2% from the record set in 2017, whereas sales for 2023 were off 46.0%.
Then we have to ask ourselves why there weren’t more sales in 2023.
My answer, as I noted above, is because of people’s aversion to change.
That was what 2023 was all about, as I wrote in my eNewsletter…
I’m no psychologist, but I believe that most humans covet familiarity. We thrive on routine. We like what we know. This is why most buyers, counterintuitively, end up buying when the market is on the way up, let alone in a red-hot seller’s market where every home has multiple offers.
And last year, sellers in the second half of the year just couldn’t accept that the “red-hot Toronto market” that they had taken as given for so many years was actually more balanced, and in some market segments, cool.
Not every prospective home seller can sell at the market peak, but it will never stop home sellers from wanting to do so.
Call that “greed” if you want and I won’t disagree, but as I noted above, the change in the market conditions, the sale process, the time on market, risk/reward equation, and public and media sentiments really turned a lot of sellers off.
The result?
Sellers didn’t want to sell.
And the result from that?
Many buyers had nothing to buy!
Sure, it’s a bit of a chicken-and-egg situation, but I had a lot of active buyers in the fall market last year who would have been happy to pull the trigger and purchase, regardless of interest rates, but who were unable to do so because nothing they liked was for sale.
And buyers’ aversion to higher interest rates, whether affordable or not, simply left a sour taste in their mouths.
Interest rates have normalized, however. And regardless of whether or not we see lower rates in 2024, I think that buyers out there are over the “woe is me” phase of lamenting periods of lower-rates, and they’ll enter the market in 2024 with a different outlook.
It’s why I expect to see a return to 90,000 sales in 2024.
Not 100,000+ like we’ve seen three times before, and certainly not 120,000+ like we’ve seen once in 2021. But there’s no reason why we won’t see 90,000 sales in 2024, and I’m making that prediction right here and now.
Okay, folks!
Not a bad start so far!
Let’s come back to this on Thursday and now that I have the “big two” on my list out of the way, I’ll roll through another five things that will be on our collective “real estate minds” on Thursday…


Different David
at 6:24 am
Happy New Year!
Too bad about Marvin, poor guy was in the wrong place at the wrong time. but it reminds me of one of my favourite lines of all time from the same movie:
“Whose motorcycle is this?”
“It’s not a motorcycle. It’s a chopper.”
“Whose chopper is this?”
“Zedd”
“Who’s Zedd?”
“Zedd’s dead baby, Zedd’s dead.”
Gabe
at 7:51 am
“Oh man, I shot Marvin in the face.”
“Well why the f*** you do that?”
“I didn’t mean to do it. It was an accident.”
😂😂😂
At least they have The Wolf, right?
Tony
at 9:34 am
David, thank you for the detailed post to begin the year but my question: how is switching to yearly data when you consistently use monthly data not considered cherry-picking?
David Fleming
at 4:02 pm
@ Tony
Fair question.
We analyze the monthly data here on TRB every month. Make sense? Monthly, we look at monthly, and no, I’m not being facetious.
TRB is a living entity. We’re on here every day, and I post three times per week. We’re living IN the market and examaning what’s happening in real time. I also write a monthly blog about the TRREB stats, typically 4-5 days into every month.
The large real estate brokerages (Re/Max and Royal LePage) made predictions that referenced the “average home price in 2024” when compared to 2023. That’s why I chose to analyze the yearly data in the post above.
However, it’s not to say that I never use yearly data, or feel it’s not relevant. Yes, the monthly data from February and March is more relevant in April when we’re discussing the market conditions that month, and if the market has changed, if listing strategies have changed, if pricing strategies have changed, etc. But the yearly data is great for historical context and when looking backward, especially if it’s a long-term view.
Marina
at 12:23 pm
I’m fully ready to be wrong, but my prediction – # sales will be up this year, but price will be down.
I can’t see # sales coming down – a lot of people put off selling due to all the changes and unfamiliarity in the market. It’s time to get off the pot, or the other thing.
But price I think will come down. Most big banks and other companies anticipate another round of layoffs in Q1/Q2. Grocery prices are going up again. I just don’t see the money to keep prices up.
But I’m willing to be proven wrong 🙂
House Keys
at 3:28 pm
Tight supply in 2023 (as evidenced by the lack of sales) is actually keeping prices higher. If more people needed to sell, than prices would probably have to come down. But until people get comfortable with the new rate environment, I would expect pricing to stay relatively steady, and sales to stay down. The question is how long people can hold out — long enough for a smooth landing, where people are buying and selling because they want to buy/sell (in this case, prices likely to stay flat to rising), or a shorter time horizon, because they are pressured to buy/sell because they need to (in this case, prices likely to fall further).
Appraiser
at 7:41 am
Great post!
Statistically, the unprecedented low number of transactions last year is certainly a remarkable phenomenon.
But the most relevant story to me is that once again the GTA real estate market in general and the 416 in particular have proven remarkably resilient.
Interest rates rising by over 400 basis point in one year was supposed to kill the market. The bank of Canada is gobsmacked that it didn’t work.
And so am I.
Appraiser
at 7:49 am
PS Clarification: By kill the market – I am referring to price$
Appraiser
at 7:51 am
“Bank of Canada says it is not seeing the decline in house prices it had expected” https://www.theglobeandmail.com/business/article-bank-of-canada-says-it-is-not-seeing-the-decline-in-house-prices-it/
Ace Goodheart
at 1:05 pm
The steep drop off in sales signaled that potential home buyers could not qualify at the price levels sellers were offering. You had this “rate chasm” where the seller expected a certain price, but when the buyer went to get pre-qualified, they could not get themselves up to that price point. So things just kind of sat.
The interesting thing now is that seller expectations have moderated significantly, and with interest rates headed back down, buyers are able to pre qualify for significantly more.
If this situation continues, the spring market could be interesting.
Appraiser
at 8:24 am
Mortgage renewal shock is real and is getting a great deal of press lately. It’s also true that there is much of it still to come for many homeowners over the next 3 years.
However, if what’s past is prologue, what we have witnessed is that the vast majority of mortgagors will absorb the monthly payment increases that are arriving without having to sell the house.
If consumers are convinced that interest rates have topped out for sure this time, we could see a very busy year ahead. Rumor has it that here is a great deal of pent-up demand.
Nobody
at 2:00 pm
Really, really depends on ability to pay and how much renewals get underwritten.
2020 buyers are looking at 70% increase in payments. That’s a big problem for people who are likely also facing very substantial childcare, sports, and possibly private school costs. Manageable if you’re in a business with rapid salary progression, like investment banking and bay street law, but not so great if you’re on a flatter income trajectory.
Highly depends on interest rate trajectory.
Nobody
at 2:07 pm
While you talk to lots of people and I’m sure there are some people that could still qualify for what they wanted to buy the MASSIVE increase in costs, and thus the dramatic reduction in qualification amount, really impacted buyers’ ability to pay.
The midtown detached market was seeing prices drop very substantially just from Spring ’23, never mind from ’22. Lots of houses on market for months and then either pulled or sold substantially below list. Assignments going 20% below developer’s list from back in the day.
Gallop
at 7:54 am
Question: How many total units of housing are there within the area(s) of interest? If there’s about 150k sales per year, what is that turnover as a %? ( my guess is 6.3M/3 people per=2.1M which would put yearly turnover at 7.1%, but that’s a total stab)
Just curious. (and if this info is readily at hand, how does turnover track over the years?)