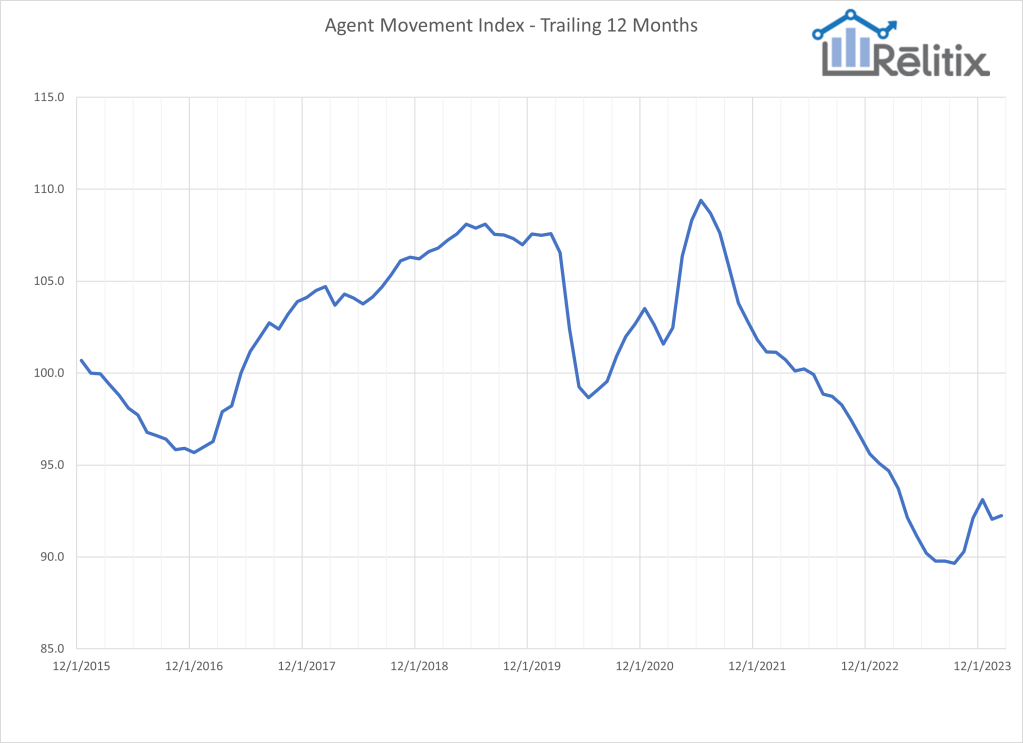
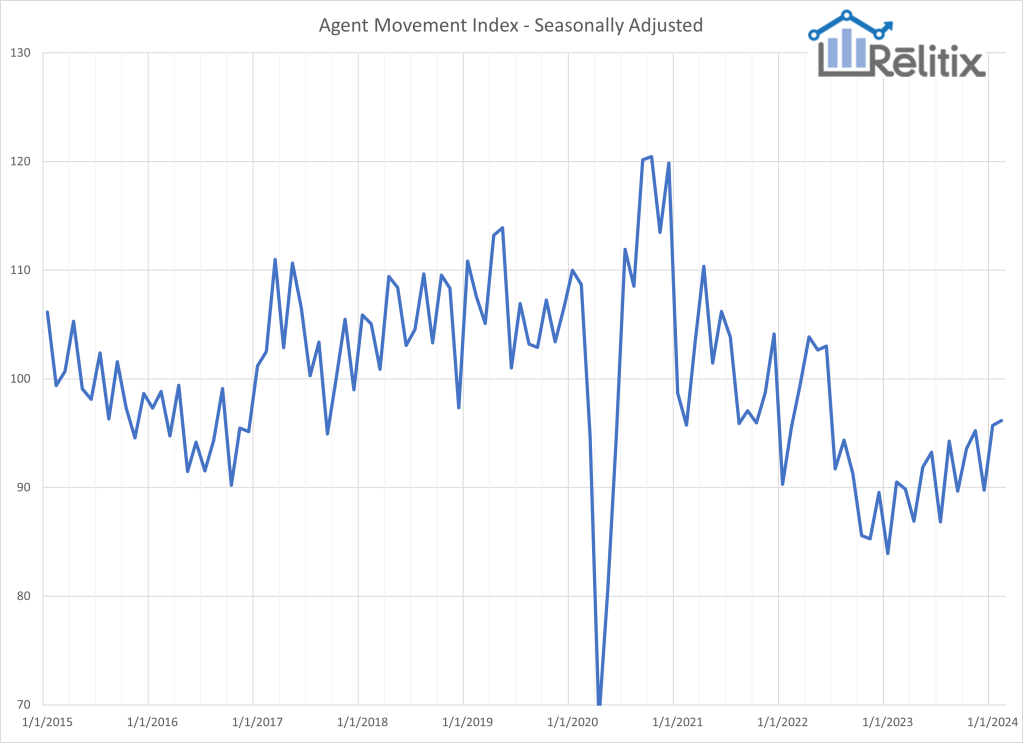
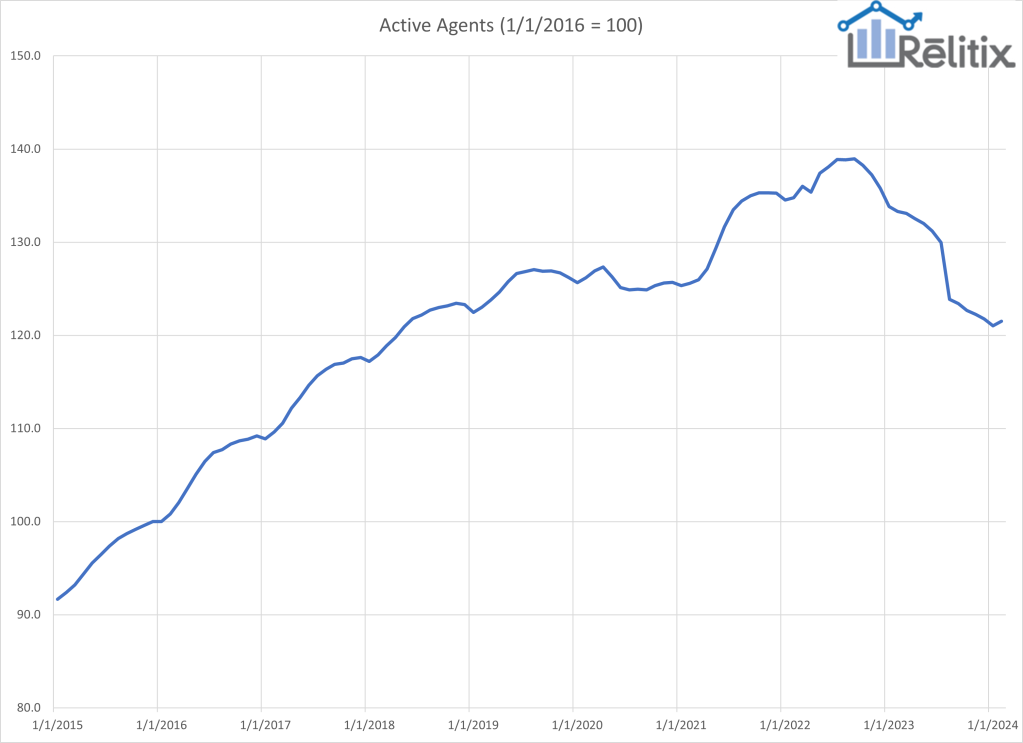
Relitix’s Agent Movement Index continues to rise on a seasonally adjusted basis as real estate agents continue the trend of switching brokerages at a faster rate than 2023. Additionally, the drop in active agent count, representing those agents with a closing in the last 12 months, has been halted. This could represent a stabilization in the agent pool which is an additional helpful trend.
We are continuing a trend toward normalization of the housing market. In addition, we are watching the count of active agents very closely. The active agent pool has declined by about 14% since late 2022 but that trend may be stabilizing.
The monthly AMI value finished at 101.9 with a seasonally adjusted value of 96.2. The January values were revised upward to 98.4 and 95.7 respectively.
Trends in the relative movement of experienced real estate agents between brokerages are an important strategic consideration for brokerage and franchise leaders. The relative amount of movement fluctuates over time on a seasonal and long-term basis.
Methodology: The Agent Movement Index is published monthly and features monthly and seasonally adjusted, and 12-trailing-month values. The index is calculated using national-level data from a large sample of the nation’s most prominent MLS systems. The agent movement reflects the relative mobility of experienced agents between brokerages. The score is computed by estimating the number of agents who changed brokerages in a given month. To be counted the agent must be a member of one of the analyzed MLS’s and change to a substantially different office name at a different address. M&A-driven activity and reflags are excluded as are new agents and agents who leave real estate. Efforts are made to exclude out of market agents and those which are MLS system artifacts. The number of agents changing offices is divided by the number of agents active in the past 12 months in the analyzed market areas. This percentage is normalized to reflect a value of 100 at the level of movement in January 2016 (0.7313%). The seasonally adjusted value divides the monthly result by the average of the same month in prior years.
Analyzed MLS’s represent over 800,000 members and include: ACTRIS, ARMLS, BAREIS, BeachesMLS, BrightMLS, Canopy, Charleston Trident, CRMLS, GAMLS, GlobalMLS, HAR, LVAR, Metrolist, MLSListings, MLSNow, MLSPIN, MRED, Northstar, NTREIS, NWMLS, OneKey, RealComp, REColorado, SEF, Stellar, Triad, Triangle, and UtahRealEstate.
Rob Keefe is founder of Relitix Data Science.

