
Didn’t I say last month that we can’t put much stake into summer market stats?
Yes.
So why are we spending time today analyzing them?
Well……..why not?
The summer is always a slow time in the Toronto real estate market, and for good reason.
A friend of mine, with whom I golf every summer, always jokes, “Remind me again, exactly why do we choose to live here?
As soon as you get into the groove with your golf game, after eight months off, it’s time to put the clubs away for fall, winter, and spring.
Summer is short. Summer is fleeting as soon as it begins.
And that’s why so many people in Toronto become two-month warriors, looking to do anything and everything before the leaves start falling.
Some neighbourhoods in Toronto are absolutely desolate in the summer. Perhaps this points to the more affluent ones, where everybody is “at the summer home,” but there are a lot of Torontonians who leave the city for weeks or even months once school lets out at the end of June.
So what does that mean for the real estate market here?
I think you can connect the dots.
And it’s not just that the market slows down because so many people are away, and/or don’t want to spend the summer months looking at real estate, but rather the sellers don’t want to risk listing when the buyer pool has been thinned down.
With that said, we do want to look at the summer as an indication of the overall market trend. And we can compare August, or July-to-August, for that matter, to previous market cycles to see whether there’s positive or negative momentum.
The fall market usually starts very quickly, and this year has been no different.
Pick any area in the city and look at it closely. Leaside, as an example. Last week, in a three-day period from Tuesday-to-Thursday, there were four new listings for houses between $2.7M – $3M, whereas there was only one listing in the same price point in the entire month of August.
On Tuesday, which is the first day “back” from summer, there were 114 new listings in C01/C08, aka “downtown.” There were days this past summer where we might only see 25-30 new listings.
We know that the market is going to be busy this fall, but where is the momentum taking us?
Let’s look at the August stats and see what we can glean.
First, here’s the updated average home price:
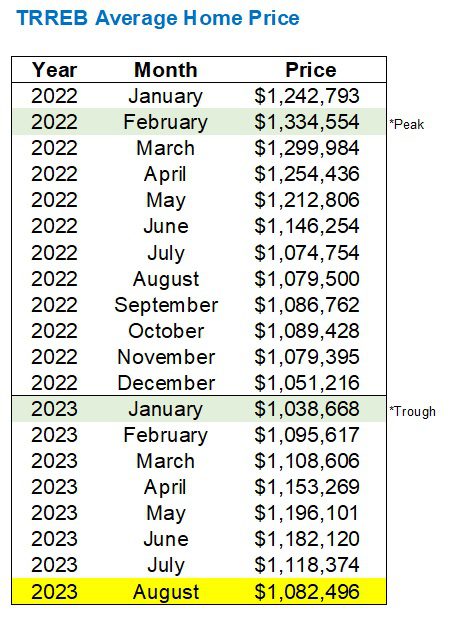
The TRREB average home price now sits at $1,082,496.
As blog reader Derek mentioned last week, we’re still (well?) ahead of the trough of $1,038,668 in January. There was much debate here on TRB about whether
The TRREB average home price declined 3.2% from July to August, and this comes after a 5.2% decline from June to July.
What does that mean?
I just said, “The market always drops in the summer,” but by how much? What’s our expectation here?
Well, if history is any indication, that 3.2% decline is bad…

Since 2002, that 3.2% decline is the largest July-to-August decline.
And it’s interesting, considering the the last three years where we saw modest increases.
We can micro-analzye those years: 2020 was the “comeback” from the pandemic and 2022 was the “comeback” from the major decline in April/May, but nevertheless, a 3.2% decline looks significant.
Now, let’s remember that there was a 5.2% decline from June-to-July.
What happens if we put that together?
What happens if we run the data for the same time period but from June through August, instead of July?
Well, it would look something like this:
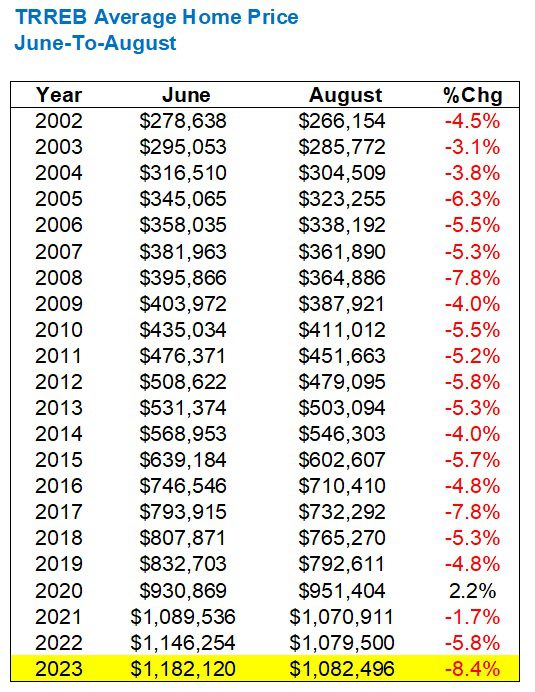
Does this look better or does it look worse?
Again, the 8.4% is the highest decline since 2002, but at least this time, there’s company.
So where does this leave us from a momentum standpoint?
Do you conclude either:
a) The market decline in the summer was substantial and that will provide negative momentum in the fall
b) The market decline in the summer was more than what is typical, which shows that a lack of inventory and sales will lead to positive momentum when the market is back in the fall
Pick your poison…
As for inventory, I showed a chart last month with “New Listings” from 2001 through 2003, demonstrating that there has been a dearth of inventory so far in 2023.
Let’s re-run that chart with the August data:
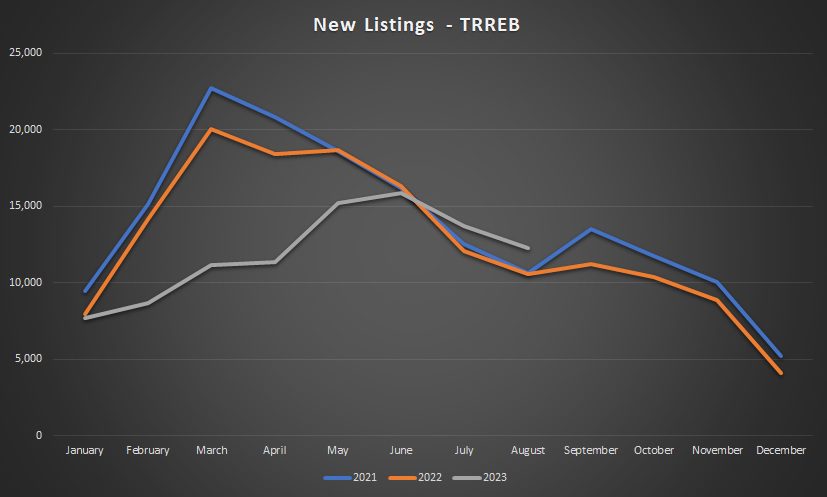
In July, we saw the New Listings poke above the charts for 2021 and 2022 for the first time this year.
But notice how 2021 and 2022 seemed to move in tandem?
They both peaked in March, they both began to trend down in April, and they both popped back up again in September after an August trough – all seemingly in unison.
But the 2023 data, thus far, has looked very different.
And now we’re seeing more inventory in August?
That was surprising.
Having said that, listings did decline from July to August, which is what we should come to expect:

Had listings increased from July to August, that would explain the price declines.
But seeing a 10.3% drop in new listings means we’re in line with expectations.
It also begs the question: why did the average home price decline 3.2%?
Sales were up modestly by 0.8%, month-over-month.
This actually points to strength in the market, considering that sales usually decline from July to August:
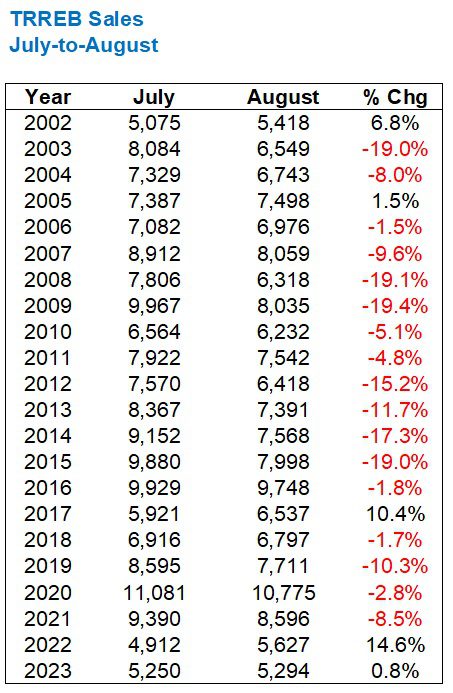
Very odd.
Sales increase while new listings decrease and the average price declines on a month-over-month basis at a record level?
Another point of strength in the market is with respect to the absorption rate.
The ratio of sales-to-new-listings increased over a yearly-low in July:
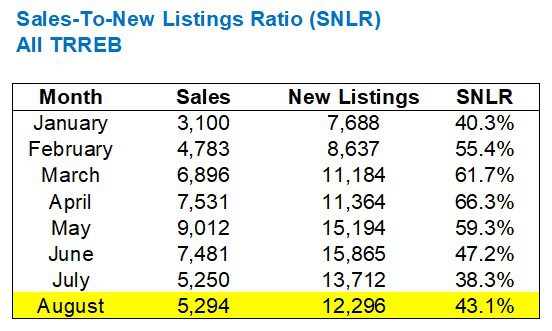
That 38.3% SNLR in July is, as I noted last month, the lowest figure I have seen in recent memory.
At 38.3%, this is so far below the 50% threshold that it should point to a buyer’s market.
But we’re not in a buyer’s market. We’re in, at worst, a balanced market. And in some areas of the central core, we’re still in a seller’s market.
If we look at the SNLR thus far through 2023, and compare to 2021 and 2022, it lines up with the year we’ve seen so far:

April’s SNLR actually beat out both 2021’s and 2022’s, and that was just as our 2023 market was peaking, from a price standpoint.
Our “slow summer” from a price standpoint is represented above with an SNLR in August that’s below that of 2021 and 2022.
All things considered, I still don’t see any data that would explain why the average home price experienced such a substantial decline from June to August.
It’s easy to say, “David, interest rates are going up,” and use that as a blanket statement to justify and explain the decline.
But I prefer to look at sales, new listings, prices, absorption rate, and any/every metric that can provide evidence of market momentum.
A friend of mine who’s listing his house this fall remarked last week, “I’m not even looking at sale prices; I just want to see properties sell.”
He was watching the market through the summer and concluded, “Nothing is moving. The houses I’m watching are just sitting.”
But are those quality listings that he’s watching? Are we expecting the hot, top-tier homes to represent the market in August? Or is August slow because the quality of listings is down?
That’s something that we’ll answer this week as we see the first set of “offer dates” on houses.
A friend of mine from another brokerage, who will like seeing her moniker in italic font, is tracking EVERY offer date in the city this September. She should have her own blog, or perhaps we should do a collaboration.
Let’s get into some more fluffy blog posts this week, then I’ll come back next week with an early look at the sales data.
Happy selling/buying, everybody!


Appraiser
at 7:01 am
With the Bank of Canada deciding not to raise interest rates last Wednesday, it will be interesting to see how the market reacts.
Will buyers see it as a green light to start looking again (and the merciful end of unprecedented interest rate increases), or will they be cautious in light of the previous two surprise increases and dismiss it as a head fake?
Marina
at 11:03 am
I’m really curious what will happen one level down – Toronto vs. GTA, vs. Golden Horseshoe, vs. rest of Ontario.
I also hope we are at the end of the upside down bananas world where small town Ontario is selling for GTA prices.
The supply side is definitely not in favour of prices falling in the 416 area. I’m looking at my neighborhood and nothing is coming up for sale in the 1.5-3M range. There were a few properties over summer and they all sold within a week, even the questionable ones with weird layouts.
John
at 1:10 pm
Here are my two cents speculation on the topic, for whatever it’s worth.
David, interest rates are going up, indeed! Which means that with everything staying equal, the monthly payments going up. Which might mean that if you can’t keep up with the increasing payments, your only option is to step down on expectations and purchase less of a property. Hence, even thought the sales are up, more of them are taking place in the lower price segments vs where they could have been, This drives the average price down but not necessary the price of each individual property,
QuietBard
at 1:31 pm
And so the plot thickens. I too am trying to figure out how the price declined when listings fell and sales went up. If anything one would think the price should have risen. Would be interesting to see if the owners that sold had locked in mortgages at the old low rates or variable mortgages at these new elevated rates. Well, lets see how inflation, GDP growth, and mortgage renewals play out in the coming months. I make no predictions, but am gonna load up on popcorn
Derek
at 2:12 pm
Sales mix? !?!?!