
I’ve never been a “watch guy.”
I had the same Casio watch from about age-5 through the end of high school, and I remember once I was in university, my father said, “You and Neil need to wear a real watch!”
My Dad took my brother and I down to The Bay, which is what somebody of that vintage would do, and we picked out a “real watch” that probably cost about $150.
That’s not a “real watch” to most people.
I remember buying a watch in New York about ten or twelve years ago. It was a classic black-and-white face with roman numerals for the numbers, and a leather strap. Raymond Weil was the brand, which I had never heard of. I just liked the look. I think it was $500 USD. I got back to the office the following week and an older agent said to me, “I think you can do better than Raymond Weil. How about a nice Omega, or maybe a Hublot?”
I don’t understand watches as a luxury item.
But then again, I stopped wearing a watch entirely about seven or eight years ago. If I need to know what time it is, I just look for the position of the sun..
As an avid sports memorabilia collector, and son to a father who literally just spent ten days in Lebanon “searching for treasure,” I understand people who collect. But watches? It just never resonated with me. I didn’t get that gene.
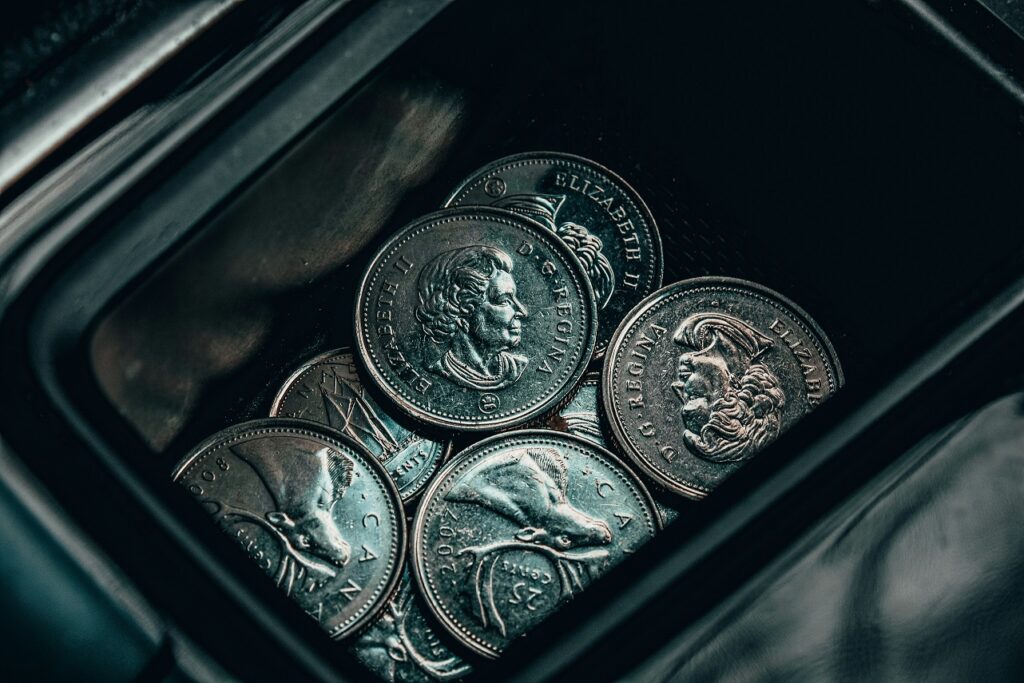
When I searched for photos of “luxury” for this blog post, I assumed I’d pick a photo of a house or a vacation spot. But can you imagine how many photos appeared that were showcasing clothing, jewelry, or watches?
That feature photo above shows a man with suspenders, cuff-links, and an expensive watch.
Is that what luxury means?
In the Toronto real estate market, “luxury” refers to properties that are valued at $2,000,000 and above.
I’ll be honest, folks, and don’t take this the wrong way, but I’ve seen a lot of houses worth $2,000,000 that are anything but luxurious!
That’s just where our market has taken us.
$1,000,000 certainly isn’t what it used to be.
But $2,000,000? It’s not even close!
I was casually paying attention to a guest speaker in our office last week when he suggested that “the luxury market has slowed in 2022, and it’s dragging down the average home price.”
This was quite interesting to me!
He noted that there were only nine sales over $5,000,000 in the month of July, compared to twenty-eight in July of last year.
Nine, down from twenty-eight, is definitely note-worthy! It’s a 68% drop!
But is it possible that a slow luxury market could actually drag down the average sale price in the GTA?
Is it possible that part of the reason why we’ve seen such a tremendous decline in the average home price since February is because fewer “luxury” homes are selling?
I’m not asking a rhetorical question here, but rather I’m actually asking aloud, and I’m going to set out in search of an answer. I’m writing this blog, live, as I input stats to Excel.
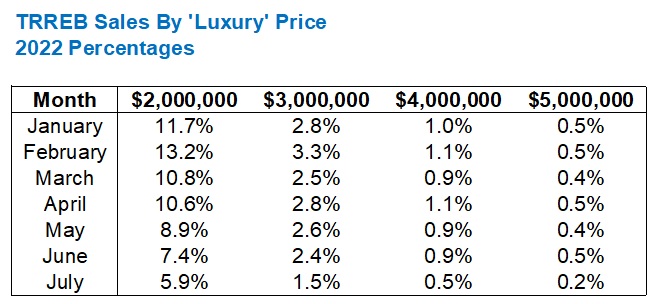
So first, I want to look at sales over four thresholds: $2M, $3M, $4M, and $5M, and I want to look at each month of 2022:

As you can see, these “luxury” sales have fallen off at every single level.
We peaked at all four thresholds in February, which coincides with the peak of the average home price.
So then, shall we stop here?
May we simply conclude, by the fact that all four thresholds saw peaks in sales in February, and that’s the peak of average home price, that a slower luxury market has dragged down the average sale price?
Not yet.
Because the absolute number of sales doesn’t matter as much as the relative number; in this case, relative to sales.
How many sales were in each month?

Ah, right!
That puts the data in perspective.
If there are half as many sales in a given threshold in a given month, but half as many total sales in TRREB, then the same relative number of sales exists.
This is why it’s so hard to simply pick one data point from which to draw a conclusion.
If we break down the sales by percentage of TRREB sales, then the table looks like this:
Perhaps this is where one should start?
That’s the problem with real estate stats, and it’s why the media always creates an argument that’s not necessarily representative of the overall market. The media might provide a headline that reads, “Sales Down 20%,” but they don’t say if that’s month-over-month, or year-over-year, and if it is year-over-year, are we down 20% from the all-time record last year? If it’s month-over-month, are we comparing July to June, in a period where sales always decline?
I digress.
So when we look at these sales as percentages of TRREB sales, we see the figures aren’t quite as dire, but they still show a declining number of luxury sales in all thresholds.
The number of $4M and $5M sales is so minimal that I don’t believe this could have an effect.
However, to see $2,000,000-and-up sales decline from 13.2% in February to 5.9% in July does tell us that the average home price is being dragged down.
So then, are we done? May we draw our final conclusion?
Nope.
Not yet.
Because we have yet to look at how 2022 compares to other years. If we saw a decline from 13.2% in February to 5.9% in July in 2021 in every year for the last decade, then we’d simply accept this as given.
Here are the stats from 2021:

I suppose it would be more helpful to look at each segment, 2021 vs 2022, so let’s do that…
Here’s the first threshold at $2,000,000:

As you can see, it’s a tale of two market halves.
2022 saw just about double the sales in January and February, and then the numbers drew even, and started to reverse.
As it stands in July, the trend is down.
And the same is true with the $3,000,000-and-up threshold:

We’re looking at half as many $3M+ sales by July, after starting out the year strong.
The pattern is identical for $4,000,000+:

Over, $5,000,000, we have the two outliers in April and June where there were more sales in 2022 than 2021, otherwise the data follows suit:

Now, if you’re one step ahead of me so far, you’re wondering, “Why are we looking at total sales, 2021 vs 2022, and not percentages?”
Good for you!
Because that’s exactly what we need to do next, and that’s exactly how to determine ‘if’ the TRREB average home price is being dragged down by a weak luxury market.
Think of it like this: if there were 1,000 sales over $2,000,000 in July of 2021, versus only 500 sales over $2,000,000 in July of 2022, but, there were 10,000 total sales in TRREB in July of 2021, versus only 5,000 total sales in TRREB in July of 2022, then it’s a wash. That would mean that the luxury home sale market has zero affect on the average home price.
So let’s have a look:

This is amazing to me!
When we look at total sales, we come to a very different conclusion.
But when we look at relative sales, we see a higher proportion of $2M+ sales in April, May, June, and July, even though total sales were lower.
In fact, for anybody that would want to argue, “The average home price is down in July because the luxury market is slow,” we can see here just how wrong that would be! We saw a 5.9% market share in July of 2022 versus a 5.7% market share in July of 2021, meaning that proportionally, there are more sales this year.
The $3M+ data looks quite similar:

Save for July, this data follows the $2M+ threshold closely.
If anybody wants to argue that $3M is luxury and $2M isn’t, then we’re splitting hairs over a 1.6% market share and a 1.5% market share.
The difference in sales has no effect.
Over $4M, we see a very similar pattern:

In July of 2021, there were 60 sales. In July of 2022, there were 25 sales. That sounds like a big difference, but when you consider that sales are down by almost half, the market share is only separated by a tenth of a percent.
Lastly, the $5M+ market shows a market share of equal-to or greater-than in all months except July:

This is fascinating!
I started this experiment simply to ascertain whether the luxury market had indeed declined, and if so, by how much. But I also wanted to know whether a weak luxury market could drag down the average home price, and whether or not it did.
Together, we can conclude that this hypothesis is false.
Fewer sales doesn’t mean “weaker market.”
Fewer proportional sales does, and we didn’t see that. In fact, we saw higher proportional sales, so if anything, we could argue, “The proportionate number of luxury sales in 2022 versus 2021 is keeping the average sale price from dropping lower.”
Did anybody see that coming?


Appraiser
at 12:17 pm
An excellent illustration as why the HPI was invented.
Relying on averages or even median sale prices can be misleading, especially in real estate.
https://www.aicanada.ca/article/average-and-its-role-in-real-estate-appraisal/
Sirgruper
at 11:33 pm
A friend worked in high end car sales $200,000 and up. Often people came in who couldn’t come close to affording the cars but were just fans and others were real buyers but I couldn’t tell by their wardrobe who was who, as the majority came in jeans and t-shirts. I asked how he knew which was which. He said it was easy. Look for the watch and the shoes. Torn jeans and a patek philippe was a buyer.
Great analysis. In the high end like many markets, people are waiting for the deals.
EastJordan
at 1:25 pm
Thanks for the analysis David but looking at those numbers I come to a bit of a different conclusion than you.
Agreed that luxury home sales aren’t pulling down the average home price. But, looking at February 2022, I think it could be argued that having 6-7% more sales in the luxury category compared to 2021 would have driven up the average price by a considerable margin.
The drop in average sales price from February to July would thus be partly explained by the return of luxury home sales to a more normal percentage of total sales.
Yes, luxury home sales are keeping keeping average sale price up right now, but not to the extend that they boosted average sale price in February to record highs.
Bryan
at 4:56 pm
I came down here to post this exact thing but you beat me to it!
For each of the $2M+, $3M+, and $4M+ segments, it seems like they stayed pretty flat as a proportion of sales in 2021(only varying between 5-7% for $2M+, 1-2% for $3M+, 0.4-0.7% for $4M+). In February 2022 however, each of these segments represented about TWICE as large a portion of total sales as in 2021. They have since fallen to about the same level as last year and the overall market seems to have followed the same trend.