
What’s that saying about the finish and the journey?
I suppose there are many.
“There is no finish line, so enjoy the journey.”
That’s a nice one and it’s got a very wide application.
“It’s good to have an end to journey toward, but it is the journey that matters, in the end.”
I like that one a lot.
For those of you who enjoy running, you’ll probably have your own saying about how your goal isn’t the finish, but rather the run itself. That is to say – you don’t run to finish, but rather you run to run.
I’m not finding the words here so let me know if there’s a runner’s proverb that I’m missing. One thing that I realized this year is that, no matter the length of the run, it most certainly is not my objective to finish but rather to experience the run and everything that comes with it. The sights, sounds, feelings, and of course the clear mind that I enjoy oh-so-much.
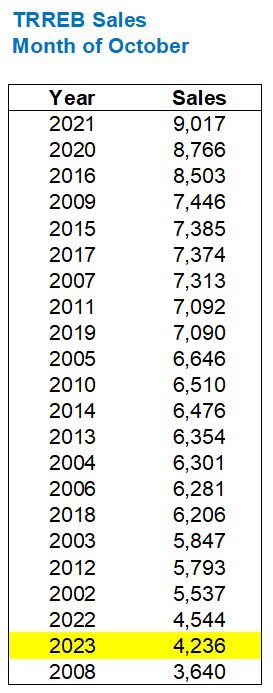
November is in the books and that means that the Toronto real estate market is just about “over.”
Not everybody agrees, of course.
I met with a prospective seller in the waning days of November whom I told to wait until February, or at least January, since December is dead. To absolutely nobody’s surprise, I saw her listing hit MLS today with an agent I had never heard of from a brokerage I had never heard of.
As I said: not everybody agrees. But this was the case of a seller who wanted to believe in something untrue and a person who was willing to tell her exactly that.
The market is still open for buyers, of course. If you’re an investor, the best time to make offers is a few days before Christmas when the market has grinded to a halt.
But for sellers? Who would list right now?
That’s rhetorical. Or not, as demonstrated above…
The “fall” market is generally September, October, and November, sometimes extending a week into December, but only in the red-hot market.
As we’ll see today, this fall was anything but “hot” and we most certainly wouldn’t expect this to be the year that we’re seeing multiple offers on listings in mid-December.
But the question remains: will the November TRREB stats and the November market activity act as a forward indicator for 2024, or could the market turn over just as easily as we turn the page of a branded Realtor’s desk calendar?
This month, the Toronto average home price declined 3.9%, month-over-month, to take us essentially back to August’s price:

I’m leaving 2021 data in there for one more month!
In this case, it shows you where current prices pull level, ie. the fall of 2022, or if you want to go “pre-peak,” then the summer of 2021.
As we can see, the average home price increased significantly from summer to fall and then came back down again.
I would argue, as I always do, that more luxury homes are sold in September and October than November, but that would only make a marginal difference.
What I do find interesting, however, is that prices have held extremely well in the face of all-time low sales. We’ll get to sales in a moment, but for now, consider that on a year-over-year basis, average home prices are essentially up.
The average Sept/Oct/Nov price in 2022 was $1,085,195.
The average Sept/Oct/Nov price in 2023 was $1,109,178.
That’s a modest 2.2% increase, but it’s important nonetheless.
We’ve seen ten interest rate increases since the spring of 2022 and we’re constantly being inundated with media reports of the government wanting to “restore affordability” by lowering home prices, and despite all that, home prices are steady.
Sure, we’re down from May of 2023, but year-over-year, we’re not seeing a decline.
I’m also acutely aware that we can make numbers say anything we want, so my taking an average of September, October, and November in 2022 and 2023 and creating a “strong market” argument could probably be rebutted in several ways. I think it’s a good metric, but let’s look at something with a bearish vibe:

This chart shows you the movement in the average home price from October to November since 2002.
As you can see, a decline from October to November is hardly a cause for concern.
In the past twenty-one years, we saw a decline sixteen times, compared to an increase on only six occasions.
But the 3.9% decline in 2023 is the largest decline ever!
Does that alone offer us an opportunity to hold a bearish outlook? Or is this, yet again, simply one metric?
As for sales, we’re coming off three straight months where the 2023 sales figure was the lowest ever in that particular month.
Well, I’m pleased to say that November sales were NOT the lowest ever!
They were the second-lowest…
A tale of two markets, right?
The highest are 2020 and 2021 and two of the three lowest are 2022 and 2023.
And yet the average home price has remained steady this year and this fall. There hasn’t been a 40% decline like people want, and inventory isn’t exactly through the roof.
To repeat the exercise we did above with respect to the average home price, let’s see how October-to-November sales typically look so we can determine if those 4,236 sales last month were lower than they “should” have been:

That’s a sea of red!
20/21 years prior, we saw a month-over-month decline in November, with the one exception being 2017, and the change was nominal.
The average month-over-month movement from 2002 through 2022 was -12.6%, so if anything, the 8.8% decline last month was lower than we might have expected.
As mentioned, we saw the lowest sales ever in the respective months of August, September, and October. What I mean by that is the sales in August of 2023, for example, were the lowest in any month of August ever. And by ever, I mean since 2002 when this specific set of TRREB data began.
(FYI - TRREB data goes back to 1998 but the boundaries are different)
So I ran a fun exercise!
I wanted to look back at every month in 2023 thus far and see where each ranked against every other respective month, dating back to 2002.
Here’s what I found:
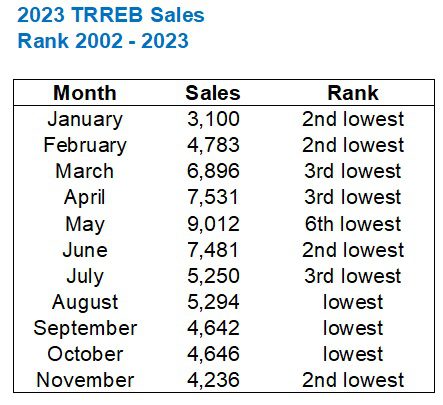
There are twenty-one years prior to 2023 in our data set, so the “best” month, in this case – May, being the “6th lowest” speaks volumes about 2023.
We started the year with the 2nd-lowest in any January, ever, and that was followed by the 2nd-lowest in any February, ever.
If that wasn’t a forward indicator, then I don’t know what is.
As you can see above, that spectacular quarter-year of August, September, and October saw record lows in sales.
Now how low are each of these months? I mean, relative to, say, the monthly average for each individual month?
Let’s average every month from 2002 – 2002 and plot the 2023 data against it. Then we’ll look at the difference, or the “decline,” if you will:
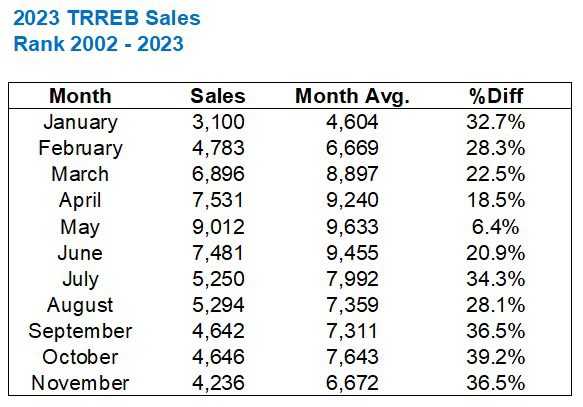
May seems to be the outlier here, once again.
But essentially from July through November, sales are around 35% lower than average.
Average.
Not lower than peak, but rather lower than the average of the sales in that individual month, from 2002 through 2022.
That’s wild!
I’m now more interested in how the sales data will look at year’s end than price.
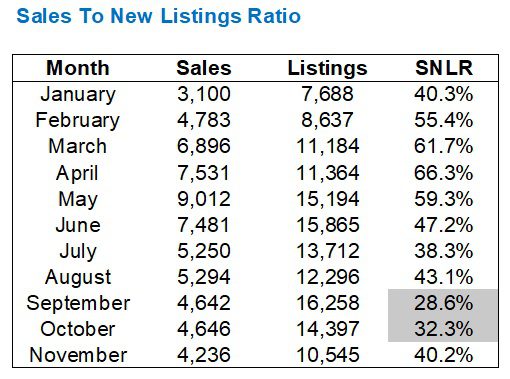
We talked a lot about the “sales-to-new-listings ratio” in recent months, notably when it hit a disastrous low of 28.6% in September, which was the second-lowest SNLR in any month from 2002 through 2023.
Last month, we saw an SNLR of 40.2% which is still very low, but nowhere near what we saw in September and October:
To be fair, we almost always see the market tighten in November and December, and I’ll show you a chart to that effect in a moment.
But if we want to see how that 40.2% stacks up against previous years, it would still rank near the bottom:
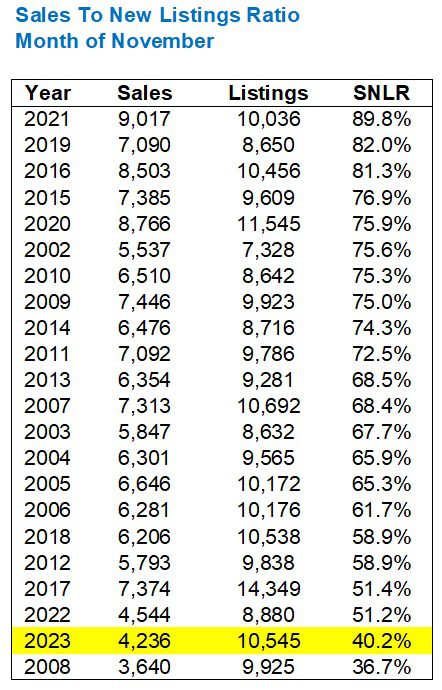
The second-lowest in any month of November.
So while the 40.2% SNLR is higher than the 32.3% figure we saw in October and much higher than the 28.6% figure we saw in September, we’re still not out of the proverbial basement.
To repeat the chart from this space last month, let’s look at 2021, 2022, and 2023 SNLR by month:

As I said, the SNLR always increases in November and December.
So an increase from 32.3% in October to 40.2% in November is to be absolutely expected.
But we’re still way, way down, and an SNLR of 40.2%, in my opinion, still signals a buyer’s market.
December is going to be a buyer’s market, no doubt about it.
But what will be in store for the New Year?
I’ve heard a lot of real estate agents of late say, “We’ve never had a bad spring.”
Looking back on it, I think that might actually be true.
The fall of 2021 was weak but the spring of 2022 was an all-time peak.
The fall of 2022 was weak but we had a huge bounce-back in the spring of 2023.
Historically, the average home price is always higher the following spring than the previous fall.
But do an SNLR in the 40% range and a year of all-time low sales suggest that next spring could remain soft?
I don’t think we’ll glean much from the December TRREB stats (although I will probably write about them next January), so it’s going to be at least 6-8 weeks before we really know what shape the market will take in 2024…


Sirgruper
at 8:40 am
My personal favourite is “I love to have run”. No matter whether you felt good or like crap during your run, you always feel wonderful that you did it.
Derek
at 12:02 pm
Will the GTA Average Home Price fall at least 4.1% month over month from November to December?
Ed
at 2:04 pm
Toronto’s average home price has dropped below that of March of 2021
Ed
at 2:14 pm
The average Sept/Oct/Nov price in 2022 was $1,085,195.
The average Sept/Oct/Nov price in 2023 was $1,109,178.
but….
The average Sept/Oct/Nov price in 2021 was $1,151,649
so are we up? Or are we down?
Ace Goodheart
at 10:30 pm
It would appear that the BoC is going to make the terrible error of cutting rates, likely in its April rate decision statement.
That move will lead to a collapse in govt bond yields, and an associated collapse in mortgage interest rates.
That should coincide with the spring market, which always gets going in May and is red hot by June.
So if someone is buying a house, really now is your time. Mortgage rates are coming down and are soft, banks are starving, looking for anyone credit worthy to loan money to, and sellers are, well, they are trying everything they can to move houses, and not having a lot of success.
Offer nights are crickets. Every property for sale in my area, save one, has been terminated and re-listed at least twice after failed offer nights and then long periods of time sitting with no sale.
Interestingly enough, it is also a great time to get work done on your house. Just this week I got a $6000 job done for $3200.00. Contractors are starving. Back in 2021 I tried to get that job done and I was told I had a month wait and it would be six grand.
Today I made some calls and by 10am I had a contractor coming to my house, to do the job today, and it was done by 5:30pm for $3200.00. I got so many call backs. People were fighting over price. I had a bidding war of contractors lowering their price to get me to hire them.
I have also made some inquiries for my long term desire of putting the slate roof back on my 143 year old house. I was quoted $120,000 to do that, back in the heady, low interest rate days of 2021, when everyone had a HELOC at 2.5% and people were throwing money around. Already, I am down to $80,000 on that and it looks like if I play the field a bit I can get a better price.
I love recessions. Everything is so cheap.