
Better late than never here, I suppose?
This is a quarterly feature here on the Toronto Realty Blog and I’m having trouble believing that the last time we worked through these numbers, the summer had ended and it was just after Labour Day.
Now here we are in the thick of winter.
Then again, this doesn’t really feel like winter, does it? How many times have we shoveled snow so far? Maybe twice?
I don’t believe in jinxes, so if it snows this weekend, it wasn’t my fault!
I also don’t want to jinx the newfound reprieve in the rental market that tenants are seeing and feeling by writing about it today, but in fairness, the warning signs were present last fall…
For the last several years, most of the articles about the Toronto rental market have shared statistics and anecdotes about how expensive prices are, how hard it is to find apartments or condos, and how at times, the market can be “unfair.”
But to start 2024, we’ve seen the sentiments change.
The first article I read about a weak rental market in 2024 wasn’t from the mainstream media, so bravo:
“Toronto Landlords ‘No Longer In The Driver’s Seat’ In 2024”
Toronto Storeys
January 5th, 2024
I suppose it depends on how you define “in the driver’s seat.”
Landlords are still free to set their own rents and can say ‘no’ to any offer to lease, so they maintain that power and advantage.
But are listings up? Yes.
Is vacancy up? Apparently.
And as recently as last weekend, we did see a story in one of the major papers about this:
“Weak Condo Market In Downtown Toronto Leads To Dip In Rental Rates, Increased Vacancy”
The Globe & Mail
February 8th, 2024
Of course, there will always be conflicting headlines.
No matter where you look, you will always find a contrarian opinion. But when there’s data used to support a position, how do you know what’s what?
“It’s Never Been Harder To Rent In Canada – Vacancy Rates Fall To 35-Year Low”
RBC Markets
February 1st, 2024
Do you trust our government?
Sorry. That was a leading question and could ilicit many responses.
I mean do you trust our government data? Would you trust a government headline?
Here’s one from Ottawa:
“Canada’s Vacancy Rate Reaches New Low As Demand Outpaces Supply”
CMHC
January 31st, 2024
But these are Canada-wide headlines and using Canada-wide data.
We want to know what’s happening in the GTA, and to do that, I always look at the downtown Toronto condo market as my standard and trusted data-set.
More specifically, TRB readers know from previous iterations of this feature that we look at C01 and C08 which is “downtown” and we look at the condominium market, not to purposely exclude freehold or to divide condos and freehold, but rather becuase it’s a more reliable data set.
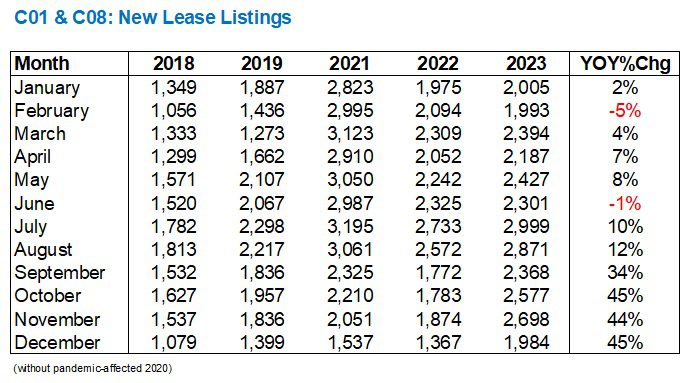
So let’s pick up where we left off at the end of the third-quarter, 2023, and see how New Lease Listings moved in the fourth quarter…
Is this what you call “an inflection point?”
Perhaps. And perhaps it also explains what’s happening in the rental market right now.
Starting with October, we can see that the 2,577 new listings were substantially higher than the 1,783 recorded the previous September.
How substantially? Try on an increase of 45% for size.
There is no way to look at this number as anything but exceptional.
2,577 listings is 45% higher than the same period in 2022.
2,577 listings is the most in these five years.
2,577 listings is 58.9% higher than the low-point of 1,627 new listings in 2018.
2,577 listings is still 16.7% higher than the preivous high-point of 2021.
Listings increased in October to upward of 2,700 and that represented a 44% year-over-year increase.
December’s new listing activity clocked in at a 45% increase as well.
Year-over-year, and fall-over-fall, these figures are huge.
But if you look at the year-over-year data from Q1, Q2, and Q3, this further underscores how much of an increase in inventory we saw!
2023 started with year-over-year monthly movements of 2%, -5%, and 4%, and that trend continued into Q2 with 7%, 8%, and -1%.
But something changed in the summer and continued into the fall.
Listings skyrocketed!
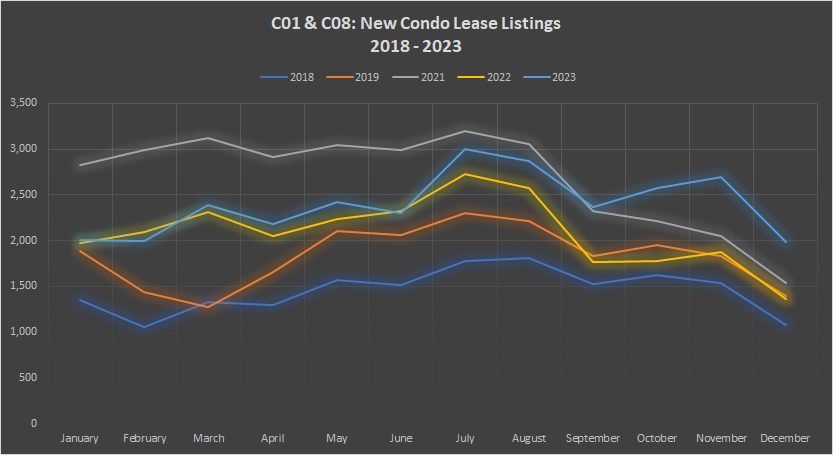
This chart shows a year that started with somewhat “average” inventory in January but finished with all-time high inventory in December.
The level throughout the year remained consistently high, relative to 2018, 2019, and 2022.
2021 might have seen a record number of new listings in most months, but the inflection point seems to have occurred in September.
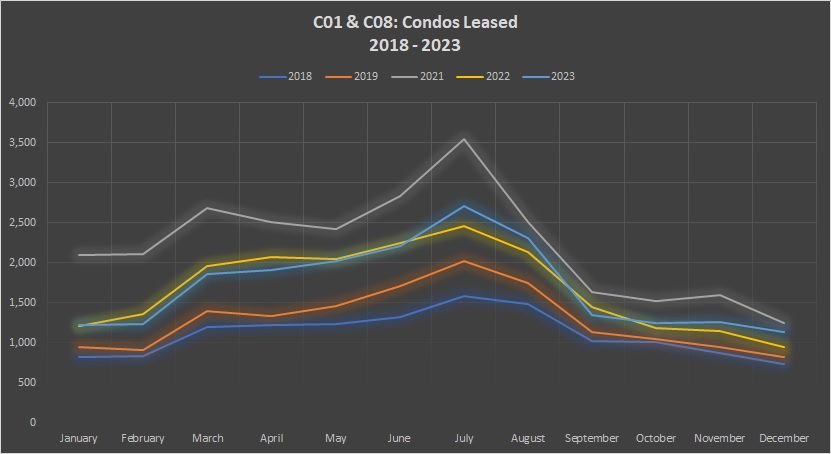
As for the leasing activity, it will speak volumes about the absorption rate…

It’s nice to see the October, November, and December figures back in the black.
Then again, it depends on which side of this you’re on.
Continuing the red ink, ie. year-over-year declines in leasing activity through the fall months, would have significantly weakened the market, given the 45%, 44%, and 45% respective increases in listing activity in September, October, and November.
It’s also fair to note, however, that these monthly year-over-year increases are based on figures from 2022 that were significantly lower than 2021.
Graphically, this tells tales:
It’s actually kind of pretty.
But it’s almost too perfect.
I had to go back and check the data multiple times as there’s just way too much consistency here.
But look at January and February: every year starts slowly. No wonder this year is starting slowly, right?
These articles that I referenced above which talk about a “weak” rental market are looking at December and January data, which are the low-points in every year from 2018 through 2023.
Why do leases spike in July every year?
Students.
A savvy student would find a lease in September – one that’s vacant and can accommodate an immediate closing date, rather than battling it out in July for units with a traditional 60-day closing, but where the number of leases is three times what it would be in September.
Now, what does all of this do to absorption rates?
The following:
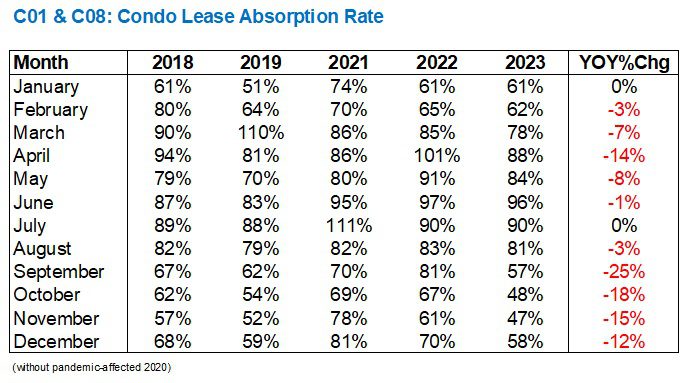
We typically think of the 50% threshold as the Mendoza line.
Actually, I don’t know if “Mendoza line” applies here, but it’s a baseball term that references a batting average of .200, which is quite poor. I actually just Googled this term for the very first time (long day and I haven’t left my desk for four hours…) and it refers to a specific player named Mario Mendoza who now has his own Wikipedia page to describe his ineptitude as a baseball player…
…anyways…
50%.
That’s the line in the sand.
Traditionally, an absorption rate or sales to new listings ratio (SNLR) of above 50% represents a seller’s market, and below 50% represents a buyer’s market.
Note how high the absorption rates are in the summer. July of 2021, we saw a rate of 111% which is crazy and shows you that more inventory was absorbed than was listed in the same time period.
This past July, we “only” saw a 90% absorption rate.
But as I said above, students could be opportunistic if they waited until September, perhaps risking not having a place lined up and having to couch-surf or AirBnB, but to avoid competition.
This year, you can clearly see where and how the market changes.
The absorption rate in August was 81%.
This compared favourably against previous years, where the absorption rates were 82%, 79%, 82%, and 83% respectively.
Then in September, that changed.
57% in September versus 81% the prior year.
Then in Q4, we saw the absorption rates consistently declining year-over-year by double-digit percentages.
That took the “curve” from the middle-of-the-pack to the very bottom:
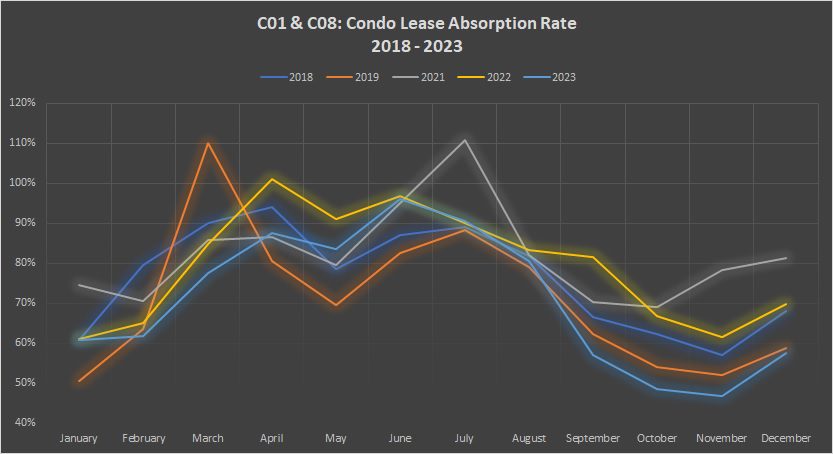
September was the turning point.
Q4 was the inflection point.
And early returns from January suggest that the rental market has not turned around.
But it will. It always does.
It might take until June instead of March, but the absorption rate always starts and finishes the calendar year slowly, while peaking in the middle six months.
When we meet in this space again, it’ll be April!
I would say “I can’t wait for the good weather,” but my kids were riding their scooters on the weekend without coats on, so I’m having trouble discerning exactly what “season” we’re actually in…


QuietBard
at 3:15 pm
Its quite frigid here in the comments section. Maybe everyone is too busy shovelling snow. Geez David, the weather didn’t even wait until the weekend to pass judgment on you, 4 hours is all it took
I recall during the summer everyone was losing their minds with the rental market and how it was impossible to find anything. The intense competition, sleazy landlord practices and the astronomical therapy bills required to deal with the trauma. Maybe its better to find an apartment during the slow season. Even if there is less choice
David Fleming
at 7:18 pm
@ QuietBard
Rental stats aren’t sexy. People come, read, absorb, and leave.
Comparing a leveraged purchase of a downtown condo for a “steal price” at $1,000 per square foot to a diversified private equity fund is going to get people commenting.
Basically, I need to write more blogs arguing that buying a 490 square foot condo in January of 2024 is the best investment since George Steinbrenner paid $8.8 Million for the New York Yankees in 1973…
Mike
at 11:28 am
David,
what site or service do you get that condo lease absorption rate stat from?
thanks
Michael
David Fleming
at 4:54 pm
@ MIKE
I download the stats from TRREB and I have a spreadsheet, about eight years running now.
These stats aren’t publicly accessible, as far as I know.