
I won’t lie to you; I definitely considered using yet another diving photo for today’s blog, but nothing quite beats Wednesday’s photo which captures the essence of how I feel, every single day, working in this market.
Yeah, that’s dark. But if you expect to open your eyes at the bottom of the ocean, and be able to see anything, then perhaps expectations are your biggest problem.
That’s a metaphor for this market we’re currently in.
Yes, that’s dark.
Over the past five weeks, I’ve had just as many people say, “Man, stop writing about the condo market,” as have asked me, “Can you keep writing about the condo market?”
Some prospective condo buyers want to know what’s going on.
Most would-be condo sellers want to bury their heads in the sand.
The saying, “What goes up, must come down” is one that market bears have held near-and-dear for many years, but in the context of our market, it’s never really held water.
So what about the opposite?
Prices that have gone down, in our market, must come back up?
My “job” here on TRB when I pen these market-stats related blogs is to tell the story of what’s happening in the market, whether the market is up or down, in this segment or that one. So while I’m noting the decline in the condo market while I have eleven active condo listings, I don’t think that’s counter-productive in any way. To me, it’s simply pointing out that when the sun sets, it gets dark out.
I do believe that the condo market will come back, and if I was to predict when, I’d say early 2021.
But how many of you bought the DOW Jones at 18,000?
That’s rhetorical, and I don’t want to hear your fantasies. In reality, most people bought back in at 22,000 or 23,000, because very few people ever, in any market, have the guts or the foresight to buy at the bottom.
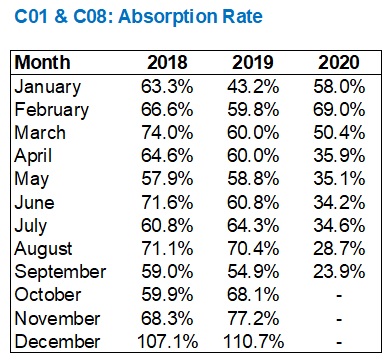
On Wednesday, I showed you the following chart with respect to the downtown condo market and the ratio of sales to new listings:
Wow.
I’ve never seen anything like it, nor did I even think I would. But then again, how cany anybody expect to see the unthinkable coming?
In that chart above, we’re looking at monthly absorption rates, and I had provided a graph in Wednesday’s blog to go with it.
Today, I want to talk about the freehold market, but more specifically how the month of September, 2020, compares to previous years.
So first, let’s see how the SNLR looks in the downtown condo market in the month of September over the past five years:

See that 71% SNLR in 2016?
That is why the market went berzerk in 2017, as many of you recall. Inventory was tight across the board, many buyers weren’t able to purchase, and those “holdover” buyers came out swinging in early 2017, and duked it out with the “new year’s” buyers.
Ignoring 2016, if you please, we see come continuity between 2017, 2018, and 2019, with SNLR’s of 58%, 59% and 55%.
Then, there’s 2020.
And that magical 23.9% that I can’t get out of my head.
So to compare to the condo market this fall to the freehold market, I figured I would run the same stats for three areas:
1) East Side – E01, E02, E03
2) Midtown – C09, C10, C11
3) West Side – W01, W02
I further chose to break it down into semi-detached, and detached, but then since the data set was so small for some areas, I ran the third chart and put them all together.
So away we go…
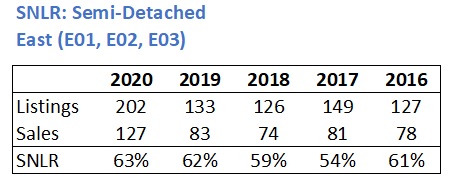
The east side is ripe with entry-level buyers looking for 3-bed, 2-bath, semi-detached houses in the high-$900’s (if they’re lucky) into the $1.2M range.
If there was any weakness in our freehold market, we’d have seen it here, first and foremost.
But instead, we’re seeing an SNLR of 63% which is actually a modest increase over the 62% in 2019 and the 59% in 2018.
Keep in mind that the fall of 2017 was depressed, on account of the market drop of April/May that year. So ignoring that 54% outlier, we see a continuous string from 2016: 61%, 59%, 62%, and 63%.
It seems that September of 2020 had the tightest SNLR of the last five years. Who saw that coming?
In the detached market, we see a similar pattern:

September saw a 46% SNLR on the east side which, again, is up 1% from 2019. It’s way up from 2018, and way-way-way up from the depressed 2017.
Put these together and we get the following:
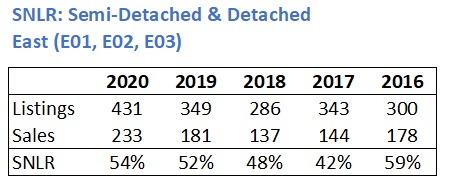
All-in-all, the SNLR is up 2% over 2019 and 4% over 2018.
Suffice it to say, inventory is tight on the east side.
–
In the central core, the semi-detached market looks slightly down, but the small sample-size is tough to work with:
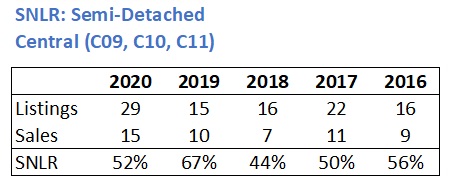
I’m not going to draw any real conclusions from this small data set, but save for 2019, it looks like we see a pattern and that 2020 hasn’t really slowed down or sped up.
There’s enough data in the detached market, and once again, 2020 sees an uptick over 2019:
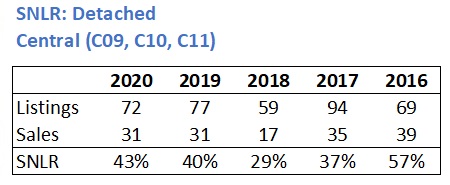
Note the outlier here – 57% in 2016. That’s yet another example of the tough 2016 fall market that led to massive price surges in the spring of 2017.
Put these together, and we’re seeing essentially what we saw on the east side:

September of 2020 was up from 2019, way up from 2018, and down from that tight 2016.
–
On the west side, I can honestly say that I don’t know how to interpret this data in the semi-detached segment:

This shows that the SNLR is the lowest at any point in the last five years.
How is that possible?
The west side is busy, albeit not quite like the east side, but I’ve seen price increases in this segment and it doesn’t “feel” like we’re overwhelmed with the inventory.
Let’s check the detached data to see if it speaks the same language:
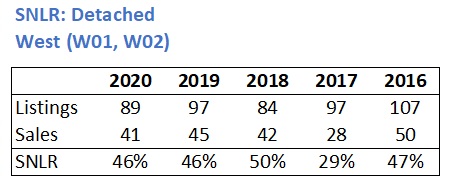
Not exactly.
The semi-detached SNLR drops from 75% to 48%, from 2019 to 2020, but stays the same at 46% in both years in the detached segment.
I double-checked the data, just in case you’re wondering!
I can’t quite make sense of that 75%-to-48% drop in SNLR in the semi-detached market, but regardless, the detached market is in line with 2016, 2018, and 2019.
So when we put this all together, that drop in semi SNLR, averaged with the detached, will likely still show weakness in September of 2020:

Precisely.
Down from 2019 and 2018, but not as out-of-whack as the semi segment made the numbers seem.
–
Overall, it looks as though the month of September was not only busy, but the supply/demand equation proved tougher for buyers than it had in previous Septembers.
A lot was made of the 11,083 sales recorded in September, which was an all-time record in that month. But there were both bulls and bears affront.
The bulls made the obvious claim: that a record month was a sign of strength.
The bears pointed out that 68% of the 11,083 sales were in the 905, with only 32% in the 416, and tried to argue that the 416 is not actually doing as well as it would seem.
But again, shall we look at this on a relative basis
The split between 905/416 in September of 2019 was 62%/38%.
The split between 905/416 in September of 2018 was 62%/38%.
So while the 905 might be seeing an uptick in activity, it’s not as though we should expect to be seeing only 40% of GTA sales taking place in the 905, when that’s just not how our market functions.
It’s really tough to deny that September was a very, very strong month in the Toronto real estate market. Even with the sluggish condo market, there’s strength in more than enough areas to make up for it.
Have a great long weekend, everybody!
Is anybody trying that service where you order the turkey, stuffing, et al to your door? I’ve never made a turkey on my own, and social-distancing from at-risk family means we might just have to give this service a shot.
I’ll let you know how it goes!


Appraiser
at 9:15 am
Great analysis as usual David. I’m sure the bears can find some scabs to pick at about the market – it’s a skill, of sorts.
Looks like more good economic news from this morning’s LFS Highlights:
“Employment rose by 378,000 (+2.1%) in September, bringing employment to within 720,000 (-3.7%) of its pre-COVID February level
Most of the employment increase in September was in full-time work, which rose by 334,000 (+2.1%), building on gains of 206,000 (+1.4%) in August.
The number of Canadians who were employed but worked less than half their usual hours for reasons likely related to COVID-19 fell by 108,000 (-7.1%) in September.
Among Canadians who worked most of their usual hours, the proportion working from home edged down from August to September, from 26.4% to 25.6%.”
https://www150.statcan.gc.ca/n1/daily-quotidien/201009/dq201009a-eng.htm
Also:
BP Says the ERA of Oil-Demand Growth Is Over:
“Oil consumption may never return to levels seen before the coronavirus crisis took hold, BP said in a report on Monday. Even its most bullish scenario sees demand no better than “broadly flat” for the next two decades as the energy transition shifts the world away from fossil fuels.” https://ca.finance.yahoo.com/news/bp-says-era-oil-demand-230100653.html
Looks like building electric cars in Oakville is a real good idea. Mark Carney saw it coming 5 years ago when he warned that a great deal of the worlds oil reserves will eventually be left in the ground as stranded assets.
Happy Thanksgiving!
Chris
at 10:12 am
August immigration numbers released:
“Canada welcomed 11,315 new permanent residents in August 2020 according to the latest Canadian government data.
This was lower than the 13,645 immigrants welcomed by Canada in July.
In addition to welcoming fewer immigrants in August than the prior month, Canada’s August 2020 total was well short of the nearly 31,600 immigrants it welcomed in August 2019.”
https://www.cicnews.com/2020/10/canada-welcomed-11000-immigrants-in-august-2020-1016026.html
Employment figures also released today. Some better news on that front, with unemployment rate ticking down to 9%. From Statistics Canada:
“The labour underutilization rate peaked at 36.1% in April and has trended downward ever since. In September, as the economy continued to recover, the labour underutilization rate fell from 20.3% in August to 18.3%, but still remained well above pre-pandemic levels (11.2% in February).”
Will be interesting to see how these figures evolve, as they’re both from a month to two ago, and we’re seemingly now facing the second wave (news expecting 900+ cases today).
Appraiser
at 11:34 am
From the article:
“The fall in Canada’s immigration levels is temporary and is a function of travel restrictions and other pandemic-related disruptions. Canada remains committed to welcoming high levels of immigration.”
Chris
at 11:47 am
Not surprising they’re trying to paint a rosy picture, as CIC News is the “online presence of the Campbell Cohen immigration law firm. Campbell Cohen helps people move to Canada.”
Too bad that their little editorialized aspirations don’t mesh with what the data is showing. But they can keep on hope-pegging!
J
at 10:31 am
“But how many of you bought the DOW Jones at 18,000?
That’s rhetorical, and I don’t want to hear your fantasies. In reality, most people bought back in at 22,000 or 23,000, because very few people ever, in any market, have the guts or the foresight to buy at the bottom.”
I’m not sure I understand the premise behind this comparison. Stock market investors don’t need to plunk down a 10% down payment at a single point in time. Thanks to liquidity, virtually non-existent transaction costs and tiny unit prices, they can and should invest gradually over time. Taking the DJ as a proxy for the stock market, anyone who started investing over time 4 or more years ago bought at less than 18,000.
Last year we tried a stuffed Butterball frozen turkey in a box; it was incredibly easy and surprisingly good.
Verbal Kint
at 11:14 am
Between automatic monthly or biweekly investment plans and dividend reinvestment plans, I’m guessing a LOT more Canadians bought equities near the bottom than bought real estate. For most people, dollar cost averaging beats trying to time the markets.
Appraiser
at 9:15 am
How many bailed out and got skinned?
I’m guessing a Lot.
When real estate gets to the point where algorithms are trading thousands of properties in nanoseconds – I’m out.
But I’m sure all you stock humpers made a killing during the great stock market debacle of 2020.
Fantasies indeed.
Chris
at 10:11 am
“ How many bailed out and got skinned?
I’m guessing a Lot.”
I’d call this anecdata but it doesn’t even rise to that level. There isn’t an anecdote here, just a guess.
Pure conjecture.
Chris
at 10:18 am
Also it’s quite rich that the other day you accused others of “praying for schadenfreude” for condo investors.
And here you are doing the exact same thing towards stock market investors. Guessing and hoping that we all got skinned by the market downturn.
Unfortunately for you, many of us have done just fine. Most people aren’t day trading their nest eggs, despite you thinking that is some “fantasy”.
Verbal Kint
at 12:16 pm
Seriously, Appraiser?
If you bail out of an investment condo in a declining market, you get hit with 4-5% commission, and then your friendly banker totes up the interest rate differential on the mortgage you’re breaking early — often five figures. Plus legals and the stress of maybe waiting weeks for a buyer. I guess the positive spin is that it’s such an expensive PITA that it serves as a commitment device — urging investors to ride through the valley of death (debt?) and up the other side. … Instead of paying $10 commission on $100k of stock at your leisure (or the triggering of a stop order), having the transaction go through in a minute, and getting the funds two days later.
Algorithms trading real estate? Already here. The old “I’ll sell your home in 30 days or I’ll buy it myself” pitch has been replaced by… the same thing, but with algorithmic appraisals and brokerages operating over much larger areas. But you knew that, because you read EVERYTHING real estate. It’s just that you only amplify some of it.
Condodweller
at 11:34 am
Was thinking the same thing as I read it and wasn’t going to post as I figured others would. The irony of course is that as the wisdom dictates that you can’t time the market. With equities, it’s easy not to do. With RE, not so much unless you are lucky enough to be able to dollar-cost averaging i.e. buy a house/condo every year or two.
Chris
at 11:53 am
Yep, good points.
If you did absolutely nothing over the past twelve months, as the market fell and climbed back up, you’re doing just fine; DJI up 6.3%, S&P500 up 15.1%, NASDAQ up 40.2%, TSX up 1.0%.
No fantasies required.
Condodweller
at 12:47 pm
Of course, a bit of a rebalance wouldn’t have hurt at the end of March. Or at the start of March, or both for that matter :-). Or better yet, if you are a real bear and sold your investment condo in January and dumped the proceeds into the market after the crash. But who would have seen that coming…
Chris
at 2:08 pm
Certainly, if you were fortunate with your rebalancing timing, or contributions to a TFSA, RRSP, or non-registered investment account, all power to you! You’ve probably done even better than the figures I shared above.
But even for those who didn’t, doing nothing has provided a pretty solid year-over-year return.
Condodweller
at 12:36 pm
“This shows that the SNLR (for West end semi) is the lowest at any point in the last five years.
How is that possible?”
Is it possible it’s due to upsizers from a condo who took on too much debt and after a job loss, or possible near term job-loss need to unload? What do the numbers look like for townhouses? They would be the next rung on the ladder before semis.
Pragma
at 2:55 pm
Eventually things will get back to normal. People will return to city cores, immigration will return to normal levels, and downtown offices will re-open. At it’s slowest it will be 4-5 years if we have to go the herd immunity path, at best its 1-2 years if a vaccine is quickly discovered and distributed. It is most definitely not Q1 of 2021 so I can’t agree condos will bounce back that soon. What will materially change over the next few months which will make condos a compelling buy in Q1? I would look at the numbers and say there are a confluence of factors that are conspiring against condos.
Q2 population growth was 25k people, compared to 175k people in Q2’19. Do we expect this to rebound over the next few quarters?
Multidwelling starts (condos, apartments,..) were at 262k thousand in August, the highest single month since 2007. Condo completions in Toronto over the next year are likely to be the highest ever.
Reduced demand + increased supply = ?
Appraiser
at 9:23 am
Your equation is not complete. Depends where equilibrium is.
Chris
at 10:27 am
Looks like someone never took Econ 101.
Changes to supply or demand that shift the curves (e.g. a pandemic), alter the equilibrium.
Reduced demand shifts that curve to the left, while increased supply shifts that curve to the right, both of which result in a lower equilibrium price point.
https://courses.byui.edu/ECON_150/ECON_150_Old_Site/images/3-3%20Equilbrium_06.jpg
Bal
at 10:28 am
Happy Thanksgiving everyone….stay safe….stay healthy
Appraiser
at 7:34 am
Hey Econ 101 genius. Explain how it is that condo inventory went up this month while prices also went up.
Verbal Kint
at 10:39 am
Sales, average and median prices were all down in September from August in 416 East+West condos. Sales and average prices were up in Central, but the median was down. SP/LP declined overall, and DOM rose. You are looking at an artifact of a change in sales mix.
J G
at 2:04 pm
416 condo price went up?
J G
at 2:23 pm
FAANG stocks are saying hi today.
Bal
at 5:46 pm
Everything is saying hi….the stocks and real estate….everything is going up…lol..end of the story…..my prediction is…real estate and stock is gonna go up and up and up and up…..lol….
Condodweller
at 7:23 pm
“I’ve never seen anything like it, nor did I even think I would. But then again, how cany anybody expect to see the unthinkable coming?”
Considering the majority of investors are in the condo space I think most “bears” at least questioned the sustainability of this segment should challenged showed up. It’s only unthinkable if you refuse to accept the possibility of something occurring.
The fact prices haven’t dropped significantly shows the strength of the market. This reminds me when I was about to put up my unit up for lease a long time ago and there were many identical units already listed in my just completed building. I was concerned how long it was going to take to lease or out and what I will be able to get in rent. My unit was one of the last ones to turn over and by the time I closed all the other ones were leased and I managed to get top $ at the time plus I had the pick of the litter.
It looks like it might just take some time for the market to speak up the units and we’ll resume the upward trajectory.
Condodweller
at 7:26 pm
Speak up = soak up. Yikes, that post reads like a 10 year old wrote it with all the autocorrect “fixes”.