
Here’s something that I will happily divulge, at the risk of people who are too sensitive or unrealistic attempting to paint this as inappropriate…
The TRG Team meets every Monday at 9:30am for our weekly meeting, and among the various topics of discussion are the “offer nights” that typically take place on Monday or Tuesday.
As to why we usually set offer dates for Monday or Tuesday, you can read more about that in a blog post that I wrote last month: “When Should You Move Your Offer Date?”
Now, while discussing our upcoming listings, active listings, and offer nights, we often play a prediction game.
Yes, a prediction game.
How many offers?
What’s the sale price?
It’s quite simple.
Personally, I think it’s pretty tame.
But I guess from the files of, “Never underestimate today’s whiner from finding something wrong with everything,” I just picture some message board or chat room where people complain, “Look at these asshole real estate agents – taking bets on how much money they can extract from poor home-buyers!”
Hmm. Maybe now it’s me that’s sensitive. Then again, nothing surprises me anymore…
This prediction game has always served as a training exercise for myself and my agents. We track every possible metric when listing properties; not just the number of showings, but the number of inquiries from agents, the number of requests for the home inspection (for a house) or status certificate (for a condo), and we aim to evaluate our listing and pricing strategies accordingly.
For those on the team who aren’t at the office through the night (usually offers end at 10pm), they’ll come into the office the next morning and look at the board to see who’s prediction was successful.
Now, we don’t just make predictions for offer nights.
In fact, we make predictions for many real estate events!
Monday was April 1st.
That’s not significant because it was Easter Monday, nor because it was April Fool’s day, but rather because April 1st would lead to April 2nd, then April 2nd would lead to April 3rd, and that is when the TRREB stats are typically released for the prior month.
So, a game, then?
With the February average TRREB sale price coming in at $1,108,720 I asked the team:
Where will the March average home price check in?
I thought I had nailed it.
$1,132,724.
That was my prediction.
Chris was too low, Jonathan was too high, and Matthew was floating around out there in no-man’s land.
But maybe I underestimated Tara?
No, not maybe. Definitely…

Bob Barker would be so proud of this!
Tara would win both prize-sets in the “Showcase Showdown.”
But for now, I’ll just chalk it up to luck, and continue being overly competitive…
So the cat’s out of the bag, but hopefully in a fun way!
The average home price in the GTA increased by 1.3%, month-over-month, and that’s after the ridiculous 8.0% increase from January-to-February.
Far-removed from 2021, let’s look at our monthly chart as it stands over the last two-years-and-change:

An optimist would suggest, “The lows of November through January are now in the rear-view mirror.”
A pessimist would say, “There’s a long way to go, in order to get back to the 2023 high, let alone the all-time high in February of 2022.”
I might suggest that we consider the best and worst-case scenarios, if that’s fair?
Talk of a recession dominated 2023, with most people suggesting that it would come in 2024, along with real estate armageddon from all these mortgage holders who were bound to default.
But that didn’t happen last year, and it doesn’t seem to be happening this year as well.
The average home price in March on a year-over-year basis was up 1.3%.
That’s after a February that saw a year-over-year increase of 1.2%.
So whether we’re expecting an increase over 2023 or whether we’re simply keeping pace, let’s not forget that historically best months in the real estate calendar are just ahead.
Now, how does last month’s action compare historically?
In what has become one of my favourite charts, I want to look at the typical February-to-March movement and see how it stacks up against last month’s 1.2% increase in average home price:

This, I did not expect!
Mind you, I started in real estate in 2004, so I can’t quite recall why the average home price would have declined from February to March, for five straight years.
But I would have almost bet that the average home price would increase from February to March every year!
Some items of note that need explaining above:
2017 was that incredible bull run that saw prices peak in April, so that 4.6% increase makes sense.
2020 was the pandemic. Enough said.
2021 was a bull run that few remember, as most still think about 2022. That 5.0% increase stands as the record.
2022 was that biggest ever 2-3 month bull run, and while the peak felt like it was through March, statistically, it was February.
That brings us to the last two years where we see the similarity in the market movement.
Now, despite the increase in month-over-month home prices, the sales data is downright shocking.
There were 6,560 sales in March.
For context, this is lower than March of 2023! And that says something, considering the entire year – 2023, saw the fewest sales this millennium.
So where do those 6,560 sales in March rank all-time?
Yikes…

Second-fewest!
Suddenly, I’m having flashbacks to 2023. This was the story, every month, if you can remember!
And for more context, those newer to the market can’t possibly imagine what March of 2021 was like. Cynics will point to all-time-low interest rates, but I personally think that the societal fallout from the pandemic was a larger driver.
When we get to inventory, perhaps we see the other side of this tale.
I constantly lament that “there’s nothing out there.” I, along with every other agent in the city, are on the lookout for new listings for our buyers, of which none ever seem to materialize.
We saw only 13,120 new listings in March, which also ranks near the bottom when you consider the history:
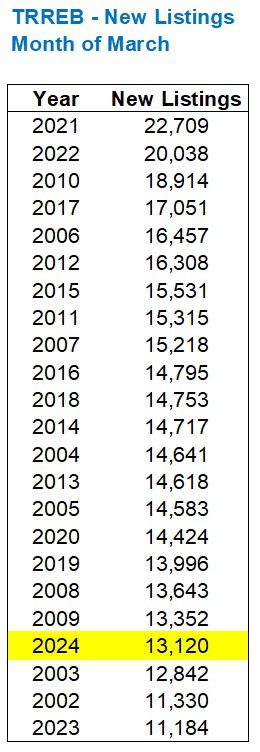
Sure, it’s the fourth-lowest and sales were at the second-lowest level, but you get the idea.
Sales aren’t low because buyers don’t want to buy.
Sales are low because inventory is low.
There were almost ten-thousand more listings in March back in 2021 than this past month!
I would argue that there’s more of a dearth of inventory in the freehold market than in the condo market, and I would challenge another agent or buyer to argue the opposite.
As for breaking down TRREB’s districts and looking at pricing, four of the “Big Five” saw month-over-month increases, which collectively (along with the other, smaller districts) made up that 1.2% month-over-month increase:
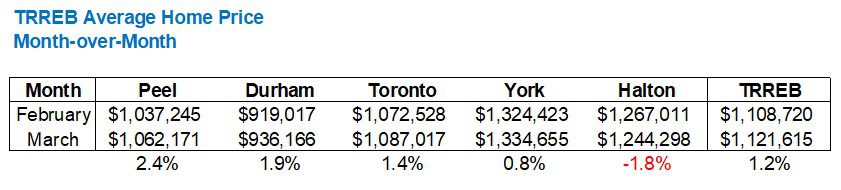
Peel Region was rather surprising to see at the head of the pack considering the year-to-date figures, which I’ll show you next.
But Toronto added another 1.4%, and that’s on top of the 11.7% increase last month.
York Region slowed down, Durham picked up, and Halton actually saw a decline.
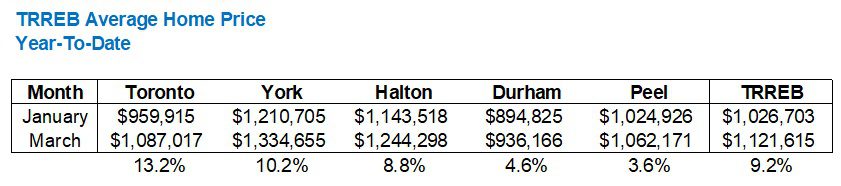
Year-to-date, all five districts are up, but Toronto’s 13.2% is carrying TRREB’s 9.2% average:
So what’s next?
Well, we have the month of April, which has zero holidays or breaks, unlike March which was broken up by public school spring breaks, private school spring breaks, and then Good Friday & Easter.
April is typically a very strong month in the market.
If I were a betting man, I would expect the average GTA home price to add another 2-3%.
That would put the average between $1,144,000 – $1,155,000 by the end of April.
Looking at how prices move from March to April historically, I found some very, very interesting data points…
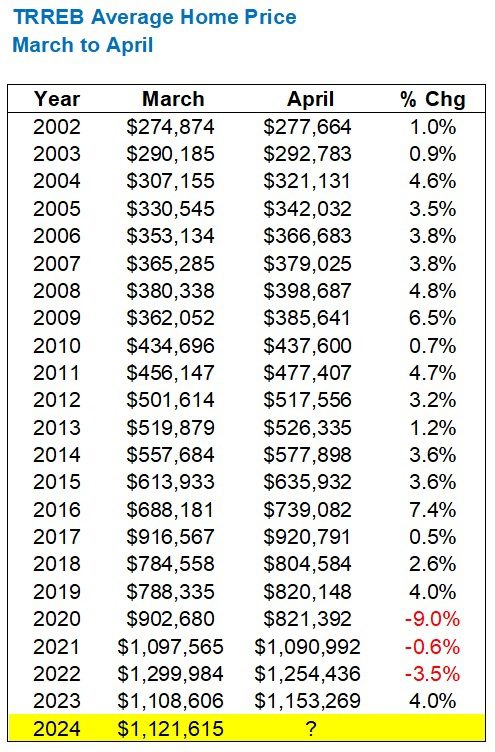
Well, you don’t see that every day!
Eighteen straight years of month-over-month increases, followed by three straight years of decline.
Then a 4.0% increase last year?
Huh?
Speak into my good ear, please. I have no idea what to make of this.
If you were told, “The average home price has increased from March to April in nineteen of the past twenty-two years,” you’d like wager that we’ll see an increase next month.
But if you were told that in three of the last four years, we saw a decline, perhaps you wouldn’t be so certain.
I’ll stick by my prediction of a 2-3% increase.
As I write this blog post on Wednesday night, we just sold a condo townhouse by accepting a bully offer, and the price was more than the same unit just sold for last month – with that unit in debatably better condition. That is the sign of a market that’s on the ascent. Or, maybe we’re just really good agents and our staging was kick-ass. You decide.
Either way, through three days in April I can already see a massive uptick in inventory.
And if you think that buyers aren’t out there, just look at the $4.6 Million house in South Leaside that was listed yesterday – and sold in multiple offers tonight. When there’s record-setting sales, in competition, in that price point, it’s hard to be bearish.
Is it not?


hoob
at 8:49 am
David’s guess has me thinking… what’s the data analysis on how people set the dollar amount in their bids?
Do most people end in $X,XXX,000 ? Of is there some other hotspot values you see (e.g. 888, current year, house number, 001, etc?
Show us the data David! How weird/superstitioous are people with the portions of their offer amounts that don’t really matter (and have you seen cases where it *has* mattered?!)
Ed
at 10:07 am
1,132,724.
724?
is that your birthday?
David Fleming
at 5:51 pm
@ Ed
Nope!
It was a completely random number. I wanted to be about 2% over the previous month, then I generated a random number.
I never like the “lucky numbers” on offers because then stats and calculations all get messy.
JF007
at 10:29 am
David how about a break down by housing types while dissecting March stats. Recall you doing that in the past but not off late. Think it gives lot more insight on where market is trending specific to a housing type.
Ace Goodheart
at 11:13 am
Interesting take on the market.
Just for fun, not actually wanting or needing a house (already have one) we went to see a place near us. From what I could see, it was over priced and they were having an “offer night”. It may be getting sold for land value. The house itself is difficult to describe in positive terms. Small, unrenovated, worn out, knob and tube, older HVAC, lead drain pipes, basically something you would have to park a bin out front of and completely gut.
There is no “wow” feeling walking through the front door. The listing has pictures of a pool in the backyard and talks about a primary bedroom with an ensuite. However, these are “artists concept” pictures, AI staging. There is no pool and no master ensuite. The idea is you could build these things, if you wanted to. They are not there yet.
So at any rate imagine our surprise when, following offer night, the property is relisted for just under $2 million and now it sits with no buyer.
This is not the only house that has received this treatment here. This seems to be the new normal. They have an offer night, house doesn’t sell, and then the next day it is relisted for a lot more money and it just sits.
A condo being built just down the street from us went into some sort of receivership. One of those large Church condos. Now sitting with no construction activity, with the sign out front still advertising occupancy by “2022” (I guess now a cruel joke to people who bought units and are still waiting to close on them).
I had a conversation with a friend renewing their mortgage. They were offered 7% on a five year fixed term. They said they thought this was a joke. It wasn’t. Apparently your credit worthyness determines your interest rate. The bank does not feel they are going to be able to keep up with payments. So off the side of the ship you go! Hope you can swim.
It’s nasty out there. I see that people in posh hoods can still afford ridiculous houses.
Everyone else seems to be struggling.
Just for fun I had a look at the zoocasa listings for cottages. There is stuff that has been relisted many times, going from the millions in asking price down to the mid level six figures, with still no buyer. Found a cottage originally listed for over a million, now down to 699K, and still sitting.
We better hope interest rates come down soon. Otherwise I think the market for resale RE is in a lot of trouble.
Derek
at 1:59 pm
Hopefully 2022 wasn’t 1989.
Appraiser
at 1:23 pm
So far not even close. I was there.
Vancouver Keith
at 11:44 am
The sales and numbers are at or near all time lows, given the fact that the population is certainly at an all time high. It takes time for the impact of higher interest rates to circulate through the economy, and with Trudeau in power for well over a year to go, I don’t foresee a bull market in the making. Going to be a stalemate of overpriced listings and buyers who can’t qualify for enough money at current rates, which are going to stabilize way above the sub 2% rate.
Appraiser
at 7:41 am
OK, looks like we are playing fill in the blanks. I’ll bite.
Prediction for April: $1,175,057
Consumers are convinced that interest rates are no longer on the rise. The debate now centres around when interest rate cuts will begin, not if.
There is nowhere for the market to go but up.
Vancouver Keith
at 1:50 pm
Canadian unemployment rate is now up to 6.1%. Canada will be cutting.
Appraiser
at 4:43 pm
Yup it is time.
Important note about latest jobs report. While total job losses across the country of 2,200 amount to little more than a rounding error, employment in Ontario grew by 26,000 new jobs.
In addition, average wage gains continue to outpace inflation: “Average hourly wages among employees rose 5.1% (+$1.69 to $34.81) on a year-over-year basis in March, following growth of 5.0% in February…” https://www150.statcan.gc.ca/n1/daily-quotidien/240405/dq240405a-eng.htm?HPA=1
Ace Goodheart
at 7:51 pm
When the current price structure for Toronto real estate was set, the BoC rate was 0.25%
The rate is now 5% and talk is it might get cut down to 4.5% by the end of this year.
So the price structure makes no sense.
These prices were set back when you could get a five year mortgage for 1.2%.
Now a fiver is 6-7%
There is just no way these prices are going to hold. Who is going to buy these houses?
I think we are seeing a market in pre- free fall (been predicting this for a while now).
Unless we get interest rates back in the sub 2% range for qualified buyers, there is nowhere to go but down for prices.
Appraiser
at 8:16 am
Also, because of the mortgage stress test buyers have to qualify at 8% or more to obtain financing. Yet here we are.
Based on historically low sales volumes and consistently weak inventory, what we are experiencing is a smaller cohort of well-qualified buyers setting prices.
A crash would require a massive and overwhelming influx of new listings in order to swamp demand.
Ace Goodheart
at 8:27 am
True.
Millions of 1.2% mortgages are set to renew at 6-7% in the next six months.
Many of these mortgages were taken out to buy second homes (rentals and cottages).
Again, if people start selling, who is buying? Who can afford to?
Appraiser
at 7:59 am
Ah yes the so-called mortgage wall. A theory that is suffering the same fate as the prequel known as the ‘deferral cliff’ (remember that scary movie?).
Ace Goodheart
at 8:47 am
Toronto real estate prices are a psychological price structure at this point. There is no economic support for the price structure as it currently sits.
If you get a bunch of distressed sellers listing properties to clear out mortgages they can no longer afford, that psychological price structure could break down.
At the point that it does, prices go into free fall and stabilize at a price point that has economic support.
That is what happened in 1989. It could happen again.
I think we will need much more than a few quarter point cuts in interest rates to stop that. The BoC rate would have to go down to maybe 2.5% or a bit less than that.
Rick Michalski P.App ACCI
at 6:49 pm
1989 was a different world. Today is nothing like that.
You’re just another in a long series of pessimists, making losing bet after losing bet against Toronto.
Interest rates will be dropping fast very soon and we will see the market pick right back up.
Appraiser
at 8:09 am
Hey impostor, looks like someone is a fanboy of the oracle of Owen Sound and thinks they are a detective too.
Pro Tip: Better be certain that you are sock pupetting the right person instead of someone who retired 2 years ago.