
Last week, we had a listing for a 1-bed, 1-bath condo, priced at $2,395/month, that produced two very competitive offers.
The first offer was from a young woman in her early 20’s, not quite “qualified” enough financially to carry the condo (GDS ratio around 42%), but with her mother co-signing for her. My teammate, Tara, spent a full day basically cyber-stalking this prospective tenant, showing me the young woman’s bio in her university alumni magazine, her resume with a slew of awards and recognitions, and a bevy of evidence to suggest that she would be an absolutely fantastic tenant!
The second offer was from a couple in their late-20’s who were looking to lease a smaller, cheaper condo in hopes of saving more money to be able to purchase a condo next year. They didn’t have the best credit but they offered all twelve months in rent up front.
Which candidate do you think our landlord-clients chose?
There’s an argument to be made that getting twelve months’ rent up front, or in this case, $28,800, would allow you to do something with that money – perhaps use it as a down payment on another investment property? However, let’s not forget that you need that money to actually pay your mortgage every month!
So what did the twelve month’s rent up front really do for the landlords? I suppose it would give them peace of mind and security. But they’d still be renting to tenants who made it clear that they want to leave in one year to purchase a place of their own, and then the landlords would be stuck looking for another tenant.
Our clients chose the first candidate, and it helped that her agent pushed her to provide four months’ rent up front to be competitive.
I told Tara, “Explain to the tenant’s agent how impressed the landlords were with her resume, and that she ‘beat’ tenants offering a full year’s rent up front. That will get back to the tenant, and you’ll have made her day.”
I don’t imagine 22-year-olds “win” much these days, but this young woman’s work ethic and track record in school and early on in her career are achievements that helped her rise above.
The rental market is quiet but that doesn’t mean it’s cold. In fact, while we’re not hearing much about the rental market, it’s picked up substantially since we last dove into this TRB feature.
It was May of this year when we posted the following chart:
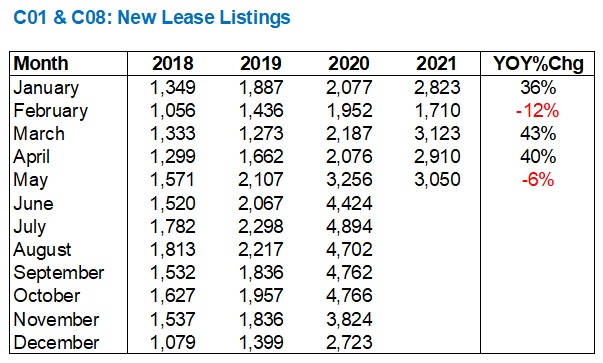
I’ve run this feature every three or four months, dating back to the early-pandemic days, and what was so eye-opening when we ran this feature in 2020 was that new lease listings had absolutely sky-rocketed.
It wasn’t just April-onward, either. When you start in January of 2020, you see a massive increase in the pre-pandemic days, which eventually led to a ridiculous surge through the summer as downtown condo-dwellers moved out in droves, and when combined with all of the AirBnb units that went from daily rentals to monthly rentals, we saw a doubling of inventory by the summer.
When we ran this feature in May, as you can see above, we were looking at even further increases in new rental listings in March and April, before a small tapering off in May.
Did that trend of increased new listings continue?
No. Not even close…
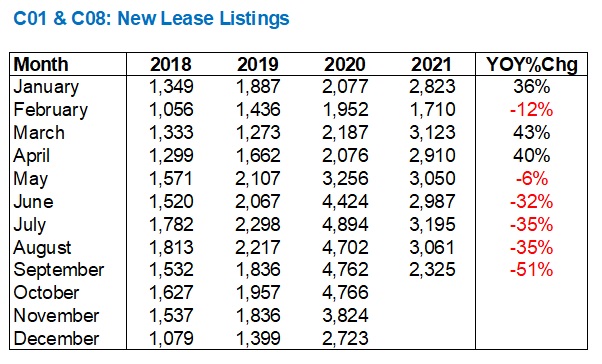
I don’t know what to say about March and April and those 43% and 40% increases, year-over-year. If I were to hazard a guess, I’d suggest that from 2018 onward, we were going to see a surge in new lease listings every year, regardless. New condo completions, active turnover, and a growing city would all lead to a higher number of condos going up for lease.
But once June rolled around, we saw the number of new listings “normalize.” With a 51% drop, year-over-year, in September, we can see that those 4,000+ listings each month from June through September of 2020 were pandemic-induced.
Now, if we removed 2020 as an “outlier,” how would the year-over-year rise in new listings look?
Like this:
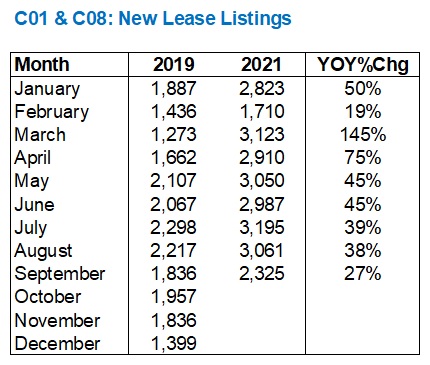
Note that if you go from March to September, the increase shrinks. This is a sign that normalizing is occuring.
We should, however, expect the number of new listings to increase every month, year-over-year, for reasons noted above.
So when we see the chart, 2018, 2019, and 2021 seem to work the way they should:

Save for the month of March, 2018 and 2019 work together in perfect harmony! They move together, and the number of new listings in 2019 is always just marginally ahead of 2018.
But the same can be said of 2021 in some respects, save for Feb/March. But for the last six months, new listings look the way they should, in relation to 2018 and 2019.
It looks like we’ll be stuck with that 2020 line on these charts for the next few years!
Alright, so what about leasing activity?
Again, it’s so tough to make sense of these figures because of the 2020 pandemic, but let’s take a look:
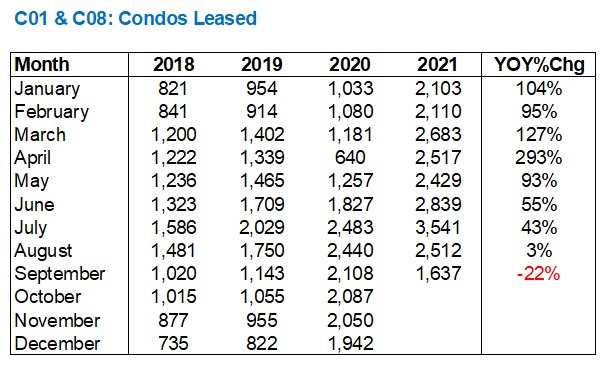
Yes, that’s a 293% year-over-year increase in April, but only 640 brave souls leased condos at the height of the pandemic last year!
For the rest of the months in 2021, leading up to September, we saw a year-over-year increase in condos leased, despite a year-over-year decrease in new condo listings.
Fewer options, more activity.
It’s no wonder that prices have risen as a result.
From Paul Danison at Rentals.ca:
For the sixth straight month, rents increased in September in the Greater Toronto Area (GTA) after hitting a two-year low of $1,971 in March.
Average monthly rents for all property types increased 0.9 per cent in September to $2,116 from $2,097 in August in the GTA, according to the latest Bullpen Research & Consulting and TorontoRentals.com Toronto GTA Rent Report.
The average rent for a condo apartment in downtown Toronto was $2,446 in September, a 10 per cent increase year over year. In the rest of the GTA, the average rent for a condo rental in September was $2,373 per month, an annual increase of 8 per cent over September 2020.
Let’s look at the number of condos leased in the downtown core from 2018 through 2021, graphically:
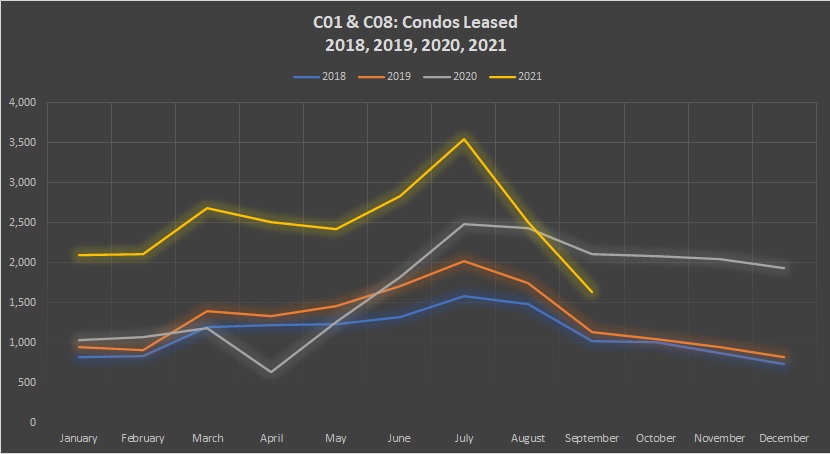
Whether you choose to see the pandemic-year as an outlier or not, comparing to 2018-2019, or even including 2020, units leased are a lot higher than
It’s tough to explain the substantial drop in leased units in the month of September, other than to suggest that an overwhelming majority of tenants seeking a September 1st possession date were active in the month of July, hence that massive spike we see on the chart above. But for the September figure to be lower in 2021 than it was in 2020 is very odd.
This could be a “blip” or it could be the beginning of a trend. It’s the first thing I’m going to look at when the October figures are released, and likely the starting point for this discussion again when we re-run this feature in January.
Regardless, the 2021 figures are still well ahead of 2018 and 2019.
But how are the units being absorbed by the market?
Whether we’re looking at leases or sales, we always want to compare the number of units sold/leased to the number of new listings on the market.
In 2020, we saw the “absorption rate” plummet when the pandemic was upon us, as the market flooded with new listings. Although the number of leased units, as you can see from the above chart, rose higher in 2020 than 2018 and 2019 in June, and remained there through the rest of the year, the absorption rate was actually lower on account of all those new listings.
So how was the trend fared in 2021?
Have a look:
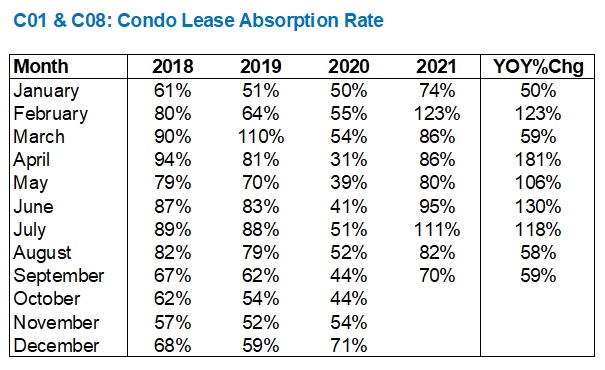
When we left off in May, we were staring at that ridiculous 123% figure from February, trying to make sense of it.
That 123% figure was followed by 86%, 86%, 80%, and then 95%, before going back above the 100% threshold as you can see in July.
You don’t need to have more than a basic understanding of an absorption rate to know how huge these figures are!
In the resale market, we’re used to seeing figures in the 60% range, and often the 70% range when the market is hot.
But to see the absorption rate From February to July bounce between a low of 80% and a high of 123% is mind-numbing.
No matter how much inventory comes onto the market, the market is ready to absorb it!
And when leased units plummeted to a mere 1,637 in September, the absorption rate still held at 70%.
Look back at previous years to compare. In September of 2018 and 2019, the absorption rate was 67% and 62% respectively, so that 70% figure in 2021, despite the massive drop in units leased, remains higher than previous years.
Pick any month in 2021 and compare to 2018 and 2019. Save for March and April, the 2021 figures are dramatically higher.
Year-over-year, if we want to look at the pandemic-affected 2020 and see how it compares to this year, the absorption rate is up substantially every single month, sometimes more than doubling, like it did in five of nine months, highlighted by April, where the absorption rate nearly tripled, going from 31% in 2020 to 86% in 2021.
Let’s look at this graphically:
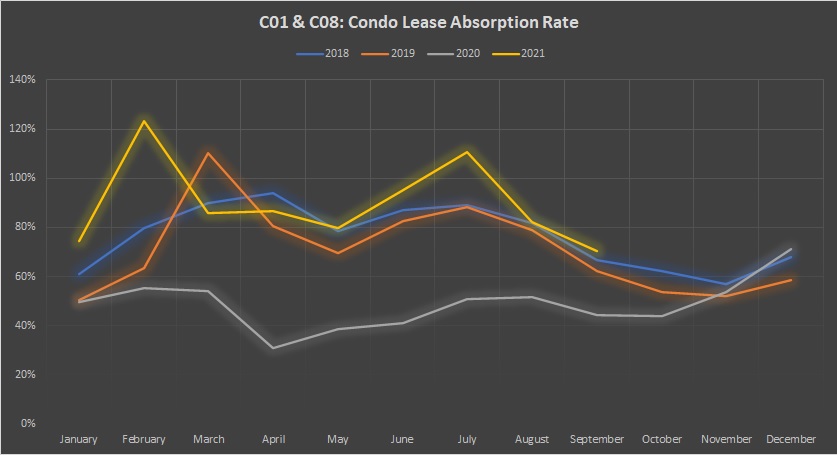
What obviously stands out in this graph is the exceptionally-low absorption rate in 2020. It’s sitting down there like a boat that sunk to the bottom of the pond!
But when you compare 2021 to 2018/2019, you’re seeing an absorption rate that’s typically higher than the previous years, with a couple of months where it’s dropped moderately below.
Overall, I’d say that the rental market is “back” from where it went in 2020
Whether this is a good thing or a bad thing remains to be seen.
Investors, landlords, and REITS are looking at this as a positive development. Obviously, potential renters are not.
For the “good of the city,” I think there’s an argument to be made both ways. A terrible rental market doesn’t help the city, and while renters may rejoice, I know that landlords are going to act shadier than ever as they did in 2020. If prices simply stabilized, we could all call it a “win.”
I’ve sold far more condos to investors in 2021 than I did in 2020, and we still have two full months left in the year. Hindsight is 20/20, but for the handful of condo investors who jumped into the condo market in the fall of 2020 when things were looking bleak, some of them are literally up 30%.
Buyers always want a deal. But when the deals are out there, the buyers aren’t buying. I mean, the experienced, long-time buyers are, as are the REITS. But first-time investors always looking for the deal will never jump in when the market is depressed. Don’t ever underestimate the power of fear.
While the downtown rental market has largely recovered from 2020, whether it continues to ascend depends largely on those investors.
By the time we revisit this topic again, it’ll be 2022. Egad! Where did the time go?


Karolina
at 8:23 am
I recently listed a rental in Yorkville area and got 2 offers in 24 hrs with over 10 showings in 2 days. Have a number of friends who are looking to come back to the city. They missed living there and hopefully with no more lockdowns this will fuel the rental market. To those who leased last year and early of 2021 you probably got an amazing lease price and had no competition. Rents will increase steadily once again. Next year will be even higher.
daveyboy
at 5:31 pm
Great time to start selling that overpriced real estate, and start renting, next couple of years will be crazy!
Appraiser
at 11:36 am
Toronto ranked best city for working women… Bloomberg
https://dailyhive.com/toronto/toronto-best-city-women
Condodweller
at 6:27 pm
Considering all the headwinds for Toronto condo rentals, we’re doing pretty well. According to rental.ca Toronto, 1 beds are $1,938 which is down a few % y/y and m/m.
https://rentals.ca/national-rent-report
Housesigma shows 1 bed units downtown renting for above $2000