
I want you to remember this blog post, and where you first heard what I’m about to say.
Because if I’m right, I want to take at least a little credit for this.
And if I’m wrong, I want you to hold me accountable.
It took less than one full week in this 2021 real estate market for me to look at a sparse number of sales and a tiny level of market activity to conclude that 2021 is going to see massive appreciation in the single-family freehold market.
Same old, same old, right?
Many of you are so tired of hearing this by now.
Some, because these sentiments don’t jive with your goals for the market moving forward.
Others, because you’re just tired of the cheerleading and perennial bullishness.
But I can’t help draw attention to what I see out there, and then there’s always that “feeling” as well. I’ve often mused that an experienced agent doesn’t need statistics but rather can gauge the market by his or her “feel” for what’s going on. I stand by that, and in speaking to other agents this week, not only are they using their gut-feeling to guide them as well, but our collective feels are aligned.
There was a sale last week that gave me that “feeling” all over again. It was the same feeling I had in early 2017 when I said, “Something is up.”
Here’s the listing from December: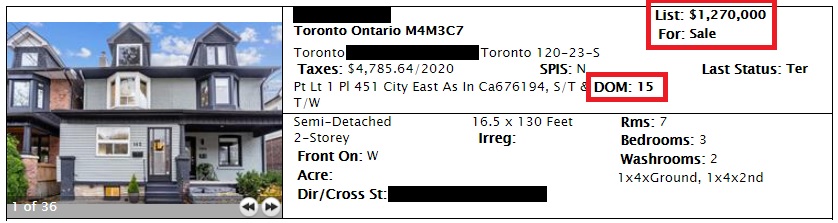
This property was on the market for $1,270,000 with offers any time.
It sat for 15 days before the listing was terminated.
What do you think this house could have sold for?
Let’s say you went in there on day-number fifteen, an offered $1,200,000. Maybe you get a sign-back of $1,260,000 which says, “We don’t like your offer, but we’re willing to play ball.” Then the dance begins, and after multiple sign-backs, where you end up?
$1,250,000? Sure.
$1,240,000? Maybe
$1,230,000? I doubt it, but you never know.
But let’s agree that a house listed for $1,270,000, with no offer date, on the market for fifteen days, almost certainly would have, could have sold for under the list price?
Great.
So when the property was re-listed last week at $999,900, with an offer date, slightly different feature photo on MLS, but everything else the same, I was quite surprised to see the property sell for this:

Quite frankly, this is absurd.
This house sold for $60,000 more in January than it would have, could have, in December.
And no, there isn’t magically a fourth bedroom this time around – they’re counting one on the main floor which has always been there.
Different listing, different agent, different year – and very different result!
But this is exactly what was happening in early-2017 and again in early-2020 before the pandemic, and it’s why I have that “feeling” all over again.
Over the holidays, a client emailed me about an expired listing that he had been watching, asking if it would come back onto the market in 2021. I called the listing agent and she said that it would be out on January 4th.
The property had been listed for sixty days at $1,525,000, and didn’t sell.
Again, can we assume that, after SIXTY days, there’s bound to be some flexibility on the price?
When the property came back out on January 4th, it was listed at $1,499,900.
“I”m not sure if that’s enough to move the needle,” I told my client, since the price drop was so modest that it probably wasn’t going to impress the market.
Later in the week, the listing suddenly had a note that read: “Offers To Be Considered On Tuesday, January 12th, 2021 at 7:00pm.”
What?
They couldn’t sell at $1,525,000, but now they’re holding back offers at $1,499,900?
I called the listing agent who I know quite well, and she anticipated exactly what I was going to ask.
“Weird, I know,” she said. “But we kinda had no choice! We had eight showings booked in the first forty-eight hours after it was all ‘crickets’ through December.”
If that doesn’t tell you how the 2021 market has started, I don’t know what will.
Again, it just gives me that “feeling” again, and I trust my gut as much, or more than the statistics available to us on a regular basis.
Now about those statistics and what they may tell us, looking into the future…
The December TRREB statistics were released last week, and while I was curious about how far the average home price would drop, I was more curious about sales.
In my December eNewsletter, I wrote the following:
“December is going to be a very slow month, in my opinion. Market fatigue is real, and the buyer pool has whittled down.”
I was dead wrong.
In fact, we witnessed the biggest December in the history of Toronto.
I predicted that the TRREB average home price would drop from November’s $955,615 down to “around” $930,000, and I was spot on, as the average price checked in at $932,222.
But that’s an easy prediction, and honestly, I take no credit.
The prediction that did matter was with respect to sales volume, and I just never saw it coming.
There were a whopping 7,180 sales in Toronto in December of 2020, and in case you’re wondering what we’re accustomed to seeing in this time period, have a look:
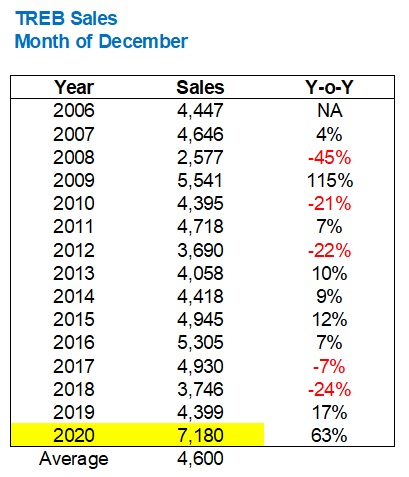
I usually don’t go back fifteen years, but I was curious. And thankfully I did because the second-highest total in the month of December came way back in 2009.
Over the last fifteen years, we’ve seen an average of 4,600 sales in the month of December. If you take out 2020, just to compare, the average for the previous fourteen years is 4,415. That means the 7,180 sales record in December is 63% higher than the average of the preceding fourteen years.
How in the world can we make sense of this?
And how did the average home price decline, month-over-month, with this type of sales activity?
Well, first we need to consider that the average home price declines every November to December.
Have a look:

We see this every year, it’s nothing new.
As to why we see this, well, I would probably start with the fact that far more of the sales in December are condos, compared to November. I mean, if you owned a single-family home in Toronto, would you look to list in December?
I also feel as though we had so many condos sitting on the market in December that there were both buyers out there, looking to secure deals, as well as sellers out there who finally just said, “Screw it, I’m selling. It’s almost Christmas.” Having sold a condo to an investor on Christmas Eve, I can personally attest to that!
If my anecdotes aren’t sufficient, then here’s some tangible evidence:
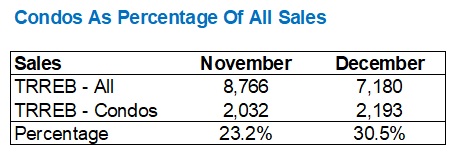
That data shows us that more condos, as a percentage of overall sales, sell in December than November, and thus the decline in TRREB average home price doesn’t actually mean your home is worth less in December than November.
But again, why were there so many sales in December? December wasn’t just a record, and it wasn’t just the first December to ever surpass 6,000 sales; it was the first month to ever surpass 7,000 sales! I simply can’t understate this.
I suppose I’ve already provided my first reason: that there were a lot of willing condo buyers out there, and a lot of willing condo sellers.
But just how willing?
Of all the charts, and all the stats that you see in today’s blog, surely this one is the most impressive:

–
Outliers.
They often mean nothing, but in this case, I simply can’t ignore it.
TRREB condo sales decline every December, and not by a little – we’re talking an average decline from 2011 through 2019 of 28.9%. So how in the world can sales increase by almost 8%?
The condo market is showing signs of life, folks. I didn’t think I’d say that today, but then I dove into the data, and look what I found?
Any way you slice it, December was just nuts!
The sales-to-new-listings ratio was off the charts.
7,180 Sales
5,865 New Listings
How in the world can you have more sales than new properties listed?
Well, it means we’re seeing September, October, and November new listings finally selling in the month of December.
122% SNLR.
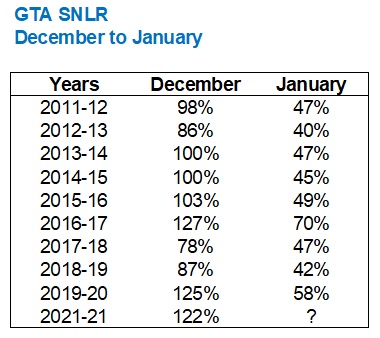
How does this stack up against previous Decembers?

Well, it’s not the highest SNLR, but it’s close!
And if you choose to look at the highest in the list, you’ll find it was in 2016.
What happened in early-2017?
The market went nuts.
A sky-high SLNR in the month of December always leads to scarcity in January. Maybe not to the same extent, but the numbers show you how tight the market is in January:
.
Again, I remember that January of 2017 like it was yesterday. The “feeling” out there was something different.
And while 2020 wasn’t exactly the same, it was enough for me to write this:
“Does January 2020 Feel Like January 2017?”
I wrote that in February of 2020 after the January TRREB stats were released, and prices were through the roof. The anecdotes about 25-offer melees on cookie-cutter 1-bedroom condos may have also contributed to that comparison, but the relative tightness of the market backed it up.
If December’s TRREB stats tell us anything, it’s that January is going to be a really tough, really tight market.
And if you’re looking at those two properties I described at the onset of this post as any indication, I won’t be saying “I was wrong” in this same space next month…


Christopher
at 7:10 am
I agree 2021 is going to start off a lot like 2017, but I’m curious why you think it won’t also end like 2017 as well?
Ed
at 11:07 am
good question!
Appraiser
at 12:53 pm
I believe a treatise on why the market will be the same as 2017, from the one who makes the proposition, is more appropriate. Don’t you?
I’ll give you a hint for your thesis @Chris: What will be the triggering event to bring the market down that is analogous to what occurred in 2017 ?
Christopher
at 1:19 pm
FOMO on the sell side after seeing 30% year over year price increases.
Appraiser
at 7:26 am
Great market data once again David.
The lesson to be learned? Snooze, ‘ya lose.
Unstoppable.
Appraiser
at 10:58 am
“Don’t Call it a Comeback: Toronto’s Condo Market is Already Heating Up Again”
December saw Toronto’s condo market activity soar to new heights.
The sector — hardest hit by COVID-19’s fallout — saw 2,193 sales in the GTA, making up 30.5% of the month’s total sales and, most notably, marking a 75.4% jump over the same month in 2019.”
https://torontostoreys.com/toronto-condo-market-heating-up-january-2021/
Chris
at 1:28 pm
“ Condo investors are rushing to buy condos at 2019 prices to earn rents that are at 2013 prices
What’s driving these decisions?
Overconfidence and cheap money!”
– John Pasalis
https://twitter.com/johnpasalis/status/1348677235243446272?s=21
Elle O'lelle
at 12:19 pm
People who are thinking about buying a $1 million plus house ( and let’s be realistic, minimum $1.4 million) need to focus less on short-medium term.
Nobody can reliably say if prices will be up or down in 12 months. For example, we might have a global pandemic which nobody can predict.
But do you think prices will be higher in 5 years? What about 10-15 years when the GTA will have millions more people?
The only risk is that you lose your job in like the first few years of your mortgage.
Otherwise buy the biggest fucking thing you can convince a bank to let you to, and let inflation and principle payments do their job over time.
Thomas
at 12:39 pm
If the market was left to itself, we would have seen entirely different outcomes. But the policy makers are giving a perception that they are prepared to go any length to keep this charade going. A lot of people are taking that as a cue to invest more in RE and stocks. This is a vicious cycle and how far this will continue is anybody’s guess! But I don’t see any signs that the moods are going to dampen this year!
However, it is hard to imagine that there wouldn’t be any counter measures in place before it is too late. It wouldn’t be pretty when that happens
Appraiser
at 1:02 pm
Yeah it’s never the open market, it’s always something else.
You know the bear rolodex routine right?
Blame it on, in no particular order: – foreign buyers, realtors, CMHC, sub-prime lending, FOMO, money laundering, mortgage brokers, banks, syndicated mortgages, federal government, provincial government, investors, bank of mom and dad, Airbnb, etc. etc.
Always something sinister and nefarious, but it’s never simply supply and demand.
Chris
at 1:26 pm
So it it simple supply and demand driving stock markets around the world to record highs? Is that why your “bull trap” thesis from last spring proved to be miles wide of the mark? Have you since given up your bearish convictions on stock markets?
Mark
at 11:29 pm
Oh come on!! How can anyone say too bad so sad if you can’t get into the market today? Gaslighting by the Re industry (just the slimey ones) to bid 150k over for a shitty property, where ppl are buying and not even viewing the tenanted basement, lol. Wow. Thats nothing to be proud of. Btw, avoid these listings with “offer dates”,
do your part to keep VALUE assessment on the prior 30 to 60 day solds. Do YOUR OWN homework and KNOW what your buying. Big deal, all these million dollar morgages, turn you into million dollar debt slaves. Banks are not your friend % rates WILL go up. Government is not your friend taxes sure as hell going to increase. Nobody is talking about the fact we are not living the quality life of going out, paying for our kids sports, vacationing, list goes on and on. You think there is all this money, but there isn’t. We all have never been through this before, (global pandemic in this day and age)and the whole RE/bank/feds are taking advantage of this and locking you in. This whole realestate game is a bull trap. I know I’m a bull. Buyers, be patient, take time, research, build up your wealth in an investment that will give back to YOU in 10, 20, 30 years, not the bank.
ALOT OF GREED going on
Ppl running this rig, motto
Not my money
Not my problem
So invest for tomorrow, be careful out there. Inventory coming. Don’t take the bait.
adam
at 1:58 pm
You just simply have to look at the stock market. Pull up a chart – the tsx looks like a better barometer than sp500.
J G
at 4:59 pm
A lot of realtors are indicating December saw an increase in sales for 416 condo, and therefore predicting 416 condo market is bouncing back up.
Per HouseSigma, sales for 416 condo was 769 for Nov, 856 for Dec. However, for the first 10 days of Jan, there are only 88 (!) sales. Is this number right?
https://housesigma.com/web/en/market?municipality=10343&community=all&house_type=C.&ign=
Karolina
at 5:15 pm
Maybe another reason for increased sales activity for condos is in addition to super low interest rates , there is no travel now during the holidays and winter months. More time to watch the real estate market and plenty of time to see condos and make deals.
Appraiser
at 9:15 am
“Dec. for 416 Condo apt sales has carried over to Jan.
First 10 days of Jan sales for condo apts: 416 total Upwards arrow52% y/y
This may support the “investors are back” narrative, as downtown is where they’re most active.” https://twitter.com/areacode416“
Chris
at 9:25 am
“Median price for all core condo apts is ⬇️6.8% y/y from $666.5K to $621K.
Median price for 0-599 sqft core apts is ⬇️6.3% y/y from $560K to $525K.”
– Scott Ingram
Over the same period, VBAL is up 7.4%. Bull trap though, right?
Chris
at 10:51 am
“Canadian households are preoccupied with shoring up their finances this year, according to a new survey, a thriftiness that could be a drag on the recovery.
Three out of four Canadians in a poll conducted by Nanos Research Group for Bloomberg News say their top financial priority is to pay down debt or retain an elevated level of savings. Only 11 per cent said they plan to make a major purchase.
The extent to which households will use up an unexpected accumulation of savings is one of the key unknowns in coming months…. Yet, given Canadians are among the most world’s most indebted households, they could choose to use the windfall to shore up their balance sheets instead.”
https://www.bnnbloomberg.ca/canadians-focused-on-savings-and-debt-not-spending-poll-1.1547281
Also remains to be seen how much of this $150B in accumulated household savings is clawed back through taxation, in an effort to deal with our ballooning government debt burdens.