
You know, when I sit down to write these stats blogs at the start of every month, I don’t always know what I’m going to say…
The truth is, I let the data write the post for me.
I look at the stats, namely price, sales, and listings, comparing month-over-month, year-over-year, and looking at moving averages. After all is said and done, I look for conclusions and present them as such.
Of course, I routinely have to dig deeper, ie. looking at prices, I might have to look at 416 versus 905, or look at freehold versus condo.
And even as I write this, today, I wonder if I will draw a conclusion about the condo market that’s in line with what we talked about in Monday’s blog.
What shocked me about the stats presented in Monday’s blog was that the 416 average condo price dropped 4.1% from December to January, but the 905 average increased by 2.1%.
On the one hand, it’s merely one month. What conclusions can we draw from one month?
On the other hand, it’s quite out of line with what we all felt out there in the market, so it requires further analysis.
First, let’s look at how the year finished with respect to sales in both the 416 and the 905.
You might recall this graph from an October blog post:
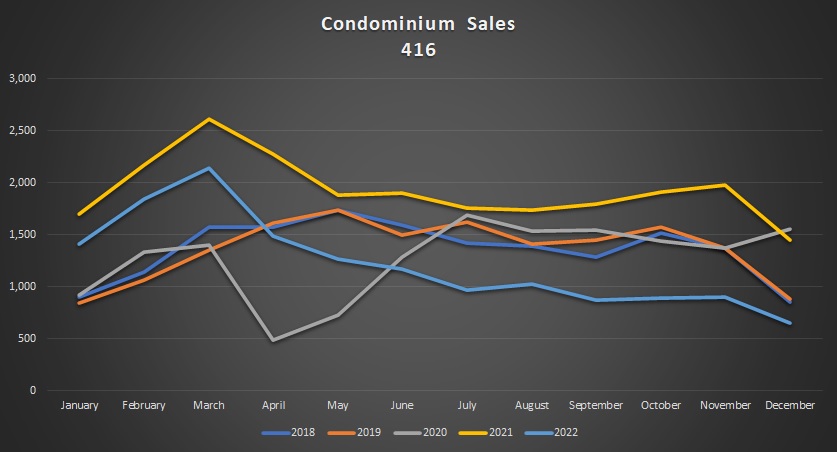
When we last looked at condo sales data, we were viewing January through September.
Since then, the downtrend continued, and the year finished well below the pace set from 2018 through 2021, although it’s worth noting that the gap widened in October and November before tightening again in December. At least, compared to 2018 and 2019.
The chart for 905 condo sales looks quite similar:

The only difference that I would note here is that there’s more deviation from previous years in December with respect to the 416 stats than the 905, but overall, both the 905 and 416 saw December figures that were lower than the previous four years.
So what that did to prices continues to astound me.
It’s not irregular to see the average condo price drop from December to January.
In fact, in the previous eleven years, this happened six times in the 416:

But that (-4.1%) figure is glaring.
It’s huge.
Not since 2011 have we seen a decline of significance, and that 2.1% decline was still half what we saw last month.
As noted on Monday, the 905 tells a different story:

In the previous eleven years, we saw a decline only four times, compared to the six in the 416.
We could also note that during peak insanity in 2022, there was an 8.0% month-over-month increase, compared to a relatively modest 4.1% increase in the 416.
But it’s still just so hard to believe that we could see a 4.1% decline in the 416 and a 2.1% increase in the 905.
Put the data together and look at all condos in the GTA, and this is what it looks like:

The conclusion here is that the 905 is holding up the overall GTA condo price. There were more sales in the 416, but without the strength from the 905, the condo market overall would look even worse by comparison.
So then it got me thinking: what’s the difference in price between your average 416 condo and your average 905 condo?
I mean, if you’re expecting to pay more for a 416 condo, how much more?
Going back to 2012, for example, an average 416 condo was worth $343,835, compared to an average of $272,103 in the 905.
That means you’d pay 20.9% more, on average, for a 416 condo.
But has this changed over the years?
Has that gap widened or shrunk?
You might think that the gap has widened as downtown properties command a premium compared to the suburbs where inventory seems to be readily available.
You might also think that the gap has shrunk as prices of both properties appreciate together on an absolute basis, with more people moving to the suburbs in search of price relief, thereby inflating the 905’s value.
In the end, it seems it was six of one, half-dozen of the other, as the decade wore on.
Let’s pick January as the month from which to pull our averages, and use the data to compare:

Note that the gap between the average 416 condo price and the average 905 condo price shrunk modestly but then expanded again after the 2017 downturn.
And further note that that gap declined rapidly thereafter, bottoming out at 5.3% in January of 2022 when the average condo prices had pulled relatively equal.
This past January, the gap sits at 9.1%, which is part of a trend that shows 905 condos have been out-appreciating 416 condos over the past couple of years.
But prices have to depend on sales, don’t they?
And if we look back at last month, sales were down across the board in every category.
When it comes to condominiums, if we take the two graphs displayed at the onset and then plot the sales from January, things look quite bleak.
Here’s the 416:
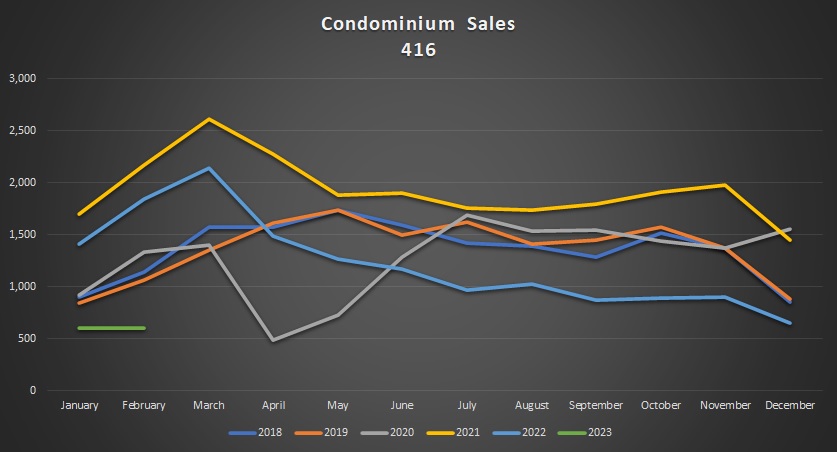
899, 840, and 918 sales in January of 2018, 2019, and 2020 seem like a good starting point.
1,703 sales in 2021 was insane.
And the 1,409 sales in 2022 were down from the year prior, but well ahead of the previous pace.
So those 604 sales last month are downright shocking. There’s no other way to put it.
Then 905 isn’t quite as bad:

376, 398, and 417 condo sales January of 2018, 2018, and 2019, so in that context, the 346 sales from 2022 aren’t terrible.
But is this an inventory problem, or is this a sales problem?
To answer that, we have to look at the absorption rate and we’ll chart that in the same way.
Here’s the 416:

As you might expect, 2022 finished quite poor.
Consider respective absorption rates in the month of December from 2018 through 2021of: 105.6%, 113.5%, 115.5%, 124.7%.
And then down to a paltry 71.1% in 2022.
So should we be surprised to see a January absorption rate of 33.1% up against rates of 59.4%, 49.0%, 65.2%, 78.9%, and 79.6% from 2018 through 2022?
Perhaps not.
But I don’t know that we can conclude “it’s an inventory problem” anymore, unless we’re talking about quality of inventory, and digging deep on the percentage of re-lists, pre-construction units, assignments, and the junk that nobody else seems to want.
In the 905, the absorption rate was just as far from the mean:

That’s 37.1% in January of 2023 compared to 51.8%, 49.4%, 65.0%, 84.6%, and 76.1% from 2018 through 2022.
If anything, this just further confuses me as to why the average condo price in the 905 went up by 2.1% from December to January.
Now, if you’re one step ahead, you’re going to ask:
“It’s obvious that the absorption rate is down for condos. But how does the January absorption rate for condos compare to other property types?”
Excellent question! So glad you asked!
And this is where we find out whether I have a point in this blog or whether you just read the preceding for absolutely no reason at all.
So let’s look at the January absorption rate for condos and compare to detached, semi-detached, and rowhouse, and do so for both the 416 and the 905:

Hmmmm….I feel like I need a gif to help with the reaction.
Ah, here:

I really wanted to use one that had Tag Team in it, but my max file size upload is 2MB and thus I had to settle for “Fat Amy” from Pitch Perfect.
Anyways…
The absorption rate for condominiums in January was, by far, the lowest among all property types.
And when we look at the 905, even though the absorption rate for condos was higher in January than that of the 416, the spread between the other three property types is even greater:

So when all is said and done, it does look like the condominium sector is the weak-link in the market so far in 2023, and any price declines or inventory declines in the overall market look much weaker because of condos.
Who’d have thunk ‘er, eh?
This could be a blip on the proverbial radar, and only February will confirm or deny that.
We’ve only had three condo resale listings so far this year and all three sold relatively quick and for good prices so maybe we’re just lucky?


Alexander
at 11:59 pm
Great post. I think the extra info on owner-occupied unit share, rents and sizes will probably make the picture look even more three-dimensional. Not sure if this info is available, though.
BoC and financial institutions worried last year about investors who could leave the market in droves. Could it be a reason for tanking condos prices in 416?
QuietBard
at 11:36 am
Is the absorption rate equivalent to SNLR? You have used both terms in different contexts so its not clear to me if they mean the same thing or not. If they arent, can you give a formal definition for AR?
Second, is it possible real estate can enter a new long term state where we have lower sales than historical averages but prices nudge higher Y/Y? I.e only the top 10-20% (financially well off) families can afford homes at current rates/prices and everyone else for the most part stays put. Thus prices are stable (because sellers dont want less and because the buyers are “high quality” they can afford them). Wouldnt that be a scenario where prices arent really dependent on sales?
Maybe the answer to why 905 condos rose and 416 fell has to do with affordability? There is a roughly 65k delta between the 2. Although I’m not really convinced either. Tricky….
Great read as always
jerry
at 3:30 am
However, given that it differs significantly from how we all perceived the market, further research is necessary. Let’s start by examining how sales in the 416 and 905 concluded for the year.
Visit here https://bestconstructionservicesusa.com USA Construction Contractors