
How is this “only two blogs per week” thing going for you?
Notice any difference?
I most certainly do!
I started Toronto Realty Blog in 2007 and I wrote blogs on Monday, Tuesday, Wednesday, and Friday. I don’t know what happened to Thursday, to be honest. It’s been a long time, but I think I typically put my “must read” post up on Wednesday so it would get two weekdays of eyes.
When I started Pick5 in 2013, I decided to “cut back” to only three blogs per week. Monday, Wednesday, and Friday.
Seemed reasonable, right?
I wrote three blogs per week for eleven years, but it finally broke me in 2023.
And that catches us up to the present.
A reader commented earlier this year, “With blogs only going out on Monday and Thursday, is that the end of The Friday Rant?”
Geez, I really didn’t think of that, and now I feel silly.
A client asked me last week, “Now that you only blog twice per week, am I to assume that the ‘fun posts’ like More MLS Musings and all the photo blogs are done?”
That wasn’t my plan, but I do realize that I haven’t done an “MLS Musings” post in 2023.
Then on Monday, a colleague said, “You’re way behind on your quarterly condo market posts.”
I told him that he was wrong, but after thinking about it for a minute or two, I realized that perhaps he was right.
Our quarterly installment of this blog staple was posted in mid-February for Q4, 2023. About a month late.
And now with 2024, Q1 in the books, I realize that this is a month overdue as well!
“Why don’t you go back to blogging three times per week?” a member of my team just asked me.
At least she said it with a smile…
The benefit of being one month overdue for this feature is that we can now look at the first four months of 2024, rather than the first three.
As you’ll see from the data below, this presents a more complete picture of the downtown condo market in 2024.
The following data is for condominium, not freehold, and for sales, not leases.
Here’s a look at the 2024 sales for the 416:
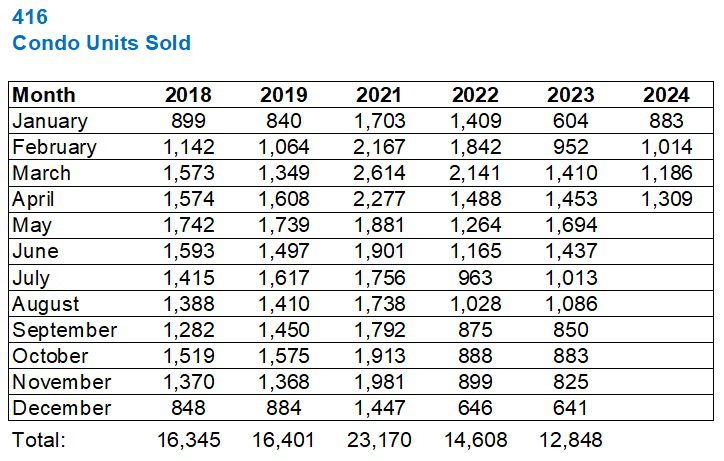
In January, we saw a 46% increase, from 604 sales in 2023 to 883 in 2024.
That’s a sign of a strong market!
Of course, these numbers pale in comparison to to 2021 and 2022, but year-over-year, that’s significant.
We saw a 7% increase year-over-year in the month of February, but then things changed.
While we continued to see month-over-month increases in the number of units sold, the year-over-year data dwindled.
Year-over-year in March was down 16%.
Year-over-year in April was down 10%.
Here’s the six-year chart (minus 2020) to get you up to speed:
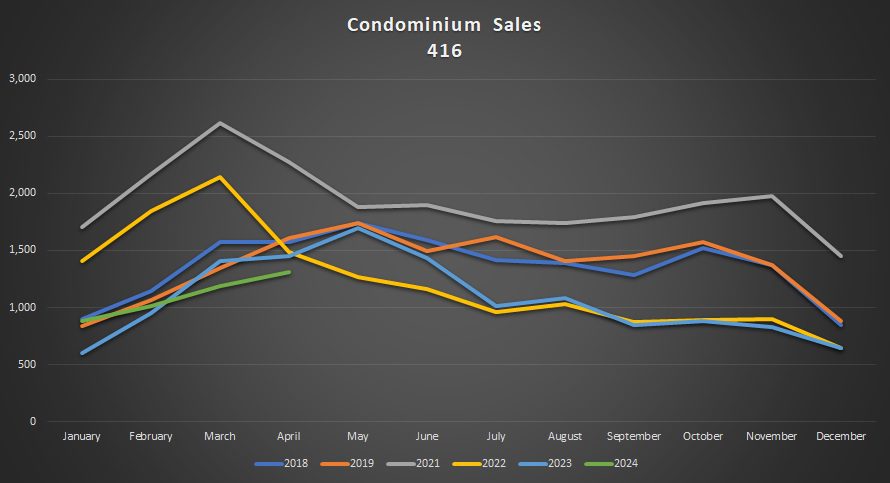
January and February looked fine.
They were in line with 2018, 2019, and 2023.
But March and April show the fewest downtown condos sold in the six-year period.
The trend was similar in the 905:
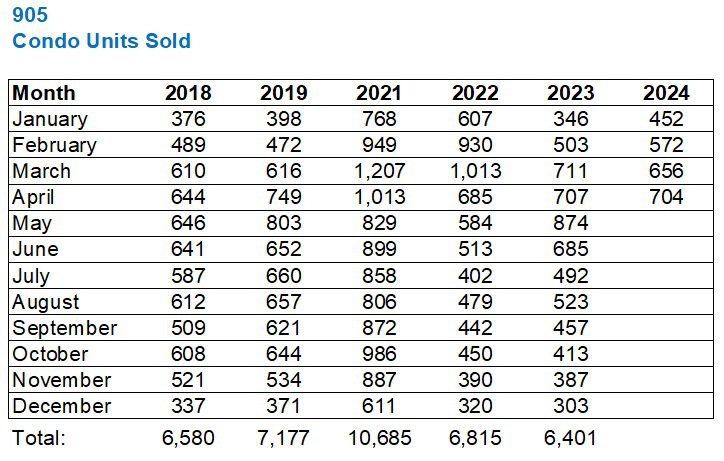
January and February saw year-over-year increases of 31% and 14% respectively.
Then we saw an 8% decline in March, with April drawing even.
Who would have thought that the 905 condo market would outpace the 416?
Not me!

This doesn’t look as bad as the 416 chart did.
These sales are completely in line with 2018, 2019, and 2023, unlike the 416 chart, where sales dropped off in March and April.
But new listings are up substantially, and that’s going to change the respective “absorption rates” in the market.
Ironically, it hasn’t changed prices, but we’ll come back to that.
Here are the absorption rates in the 416:
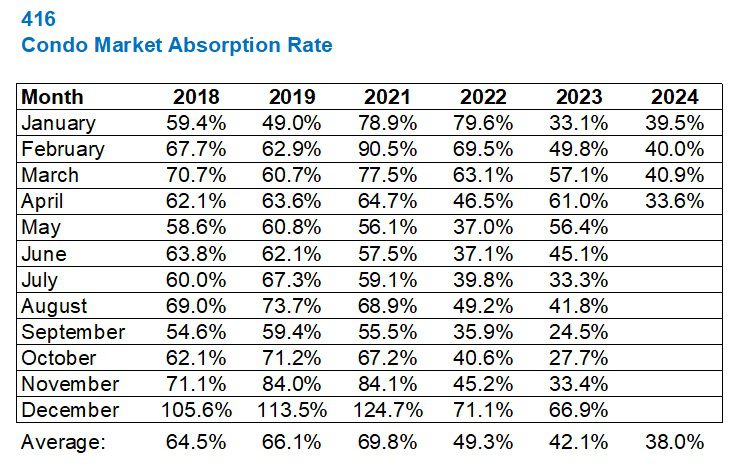
January wasn’t bad compared to 2023, but it was well below 2018 and 2019, and obviously dwarfed by the insane numbers we saw in 2021 and 2022.
But the absorption rate has been declining throughout the spring.
April saw an absorption rate of a mere 33.6%, and if you take out April of 2022, which was the “big fall off” after the government announced sweeping changes, then we see rates of 62.1%, 63.6%, 64.7%, and 61.0%, all up against that 33.6% figure.
That doesn’t seem right.
Then again, did prices drop?
We’ll come back to that!
Here’s the data graphically, which packs a bit more of a punch:
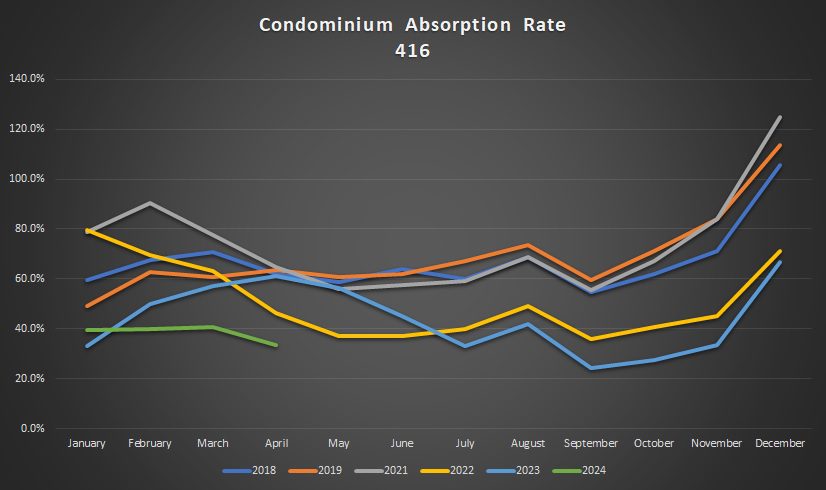
It’s hard to see that green line and think “seller’s market,” so I’m surprised when I see condo listings with offer dates.
A young agent in my office announced a new listing this week and I was quite happy for him. But then he said the words “offer date,” and considering this is C- real estate at best, I wondered what the hell he was thinking.
The market is still good, don’t get me wrong. But listing low with an offer date is a strategy that’s only going to be successful if the property is a brick-and-beam loft or something unique.
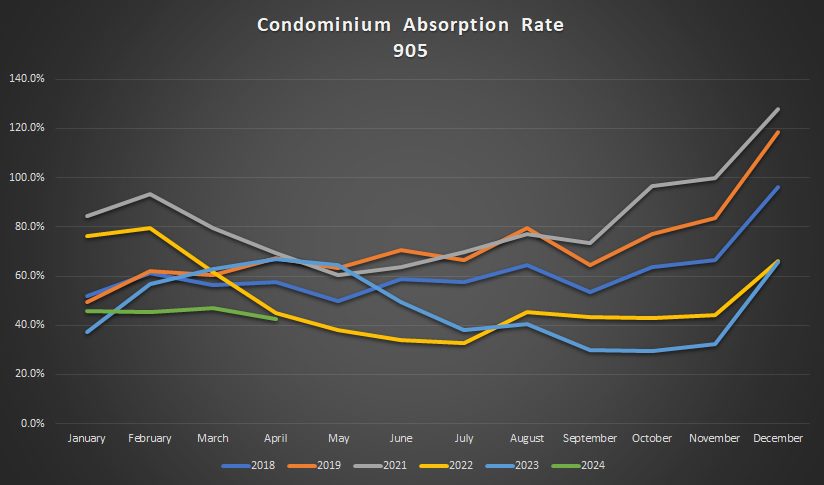
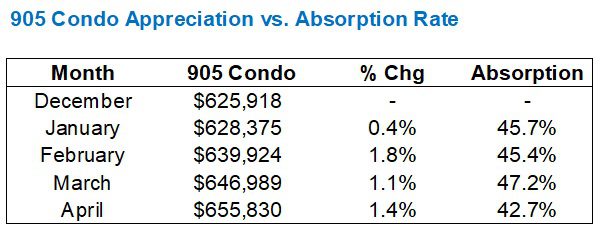
The absorption rate in the 905 is higher but it also saw less of a drop from March:
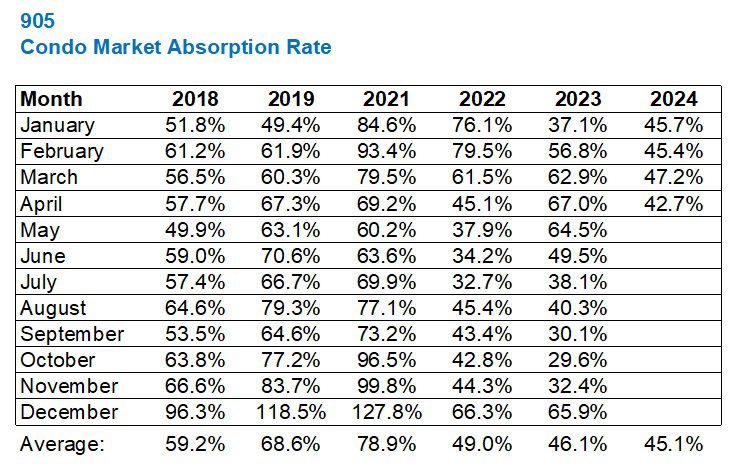
The 905 has an average absorption rate of 45.1% through four months compared to an average absorption rate of 38.0% in the 416.
The absorption rate in the 905 dropped from 47.2% to 42.7%, March to April; that’s 4.5%.
The absorption rate in the 416 dropped from 40.9% to 33.6%, March to April; that’s 7.3%.
The 905 condo market seems to be outpacing the 416 market right now, or so says just about every metric.
This chart doesn’t look as dire as the 416:
But how is the absorption rate impacting prices?
Isn’t that all that matters?
For those who are bearish and will look at this data and conclude, “The market is soft,” or even worse, “The market is in trouble,” I would suggest that we consider how the absorption rate affects prices.
With an absorption rate this low, you might think that prices are declining, right?
Except, they’re not…
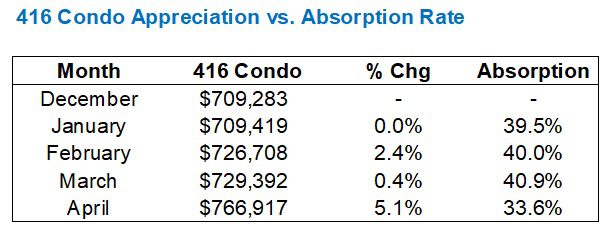
December’s price is only in there so we can look at the month-over-month change to start 2024.
But what I find amazing is that even when the absorption rate, which was already below 50%, dropped from 40.9% in March to 33.6% in April, the average condo price increased by 5.1%.
How could this be?
And for all the talk about how the 905 is “outpacing” the 416, note that the higher and less volatile absorption rate did not translate into better prices:
Now, a final thought.
We don’t usually look at new listings in this blog feature, since it’s inherent when we consider absorption rate.
But this chart is worth a look:
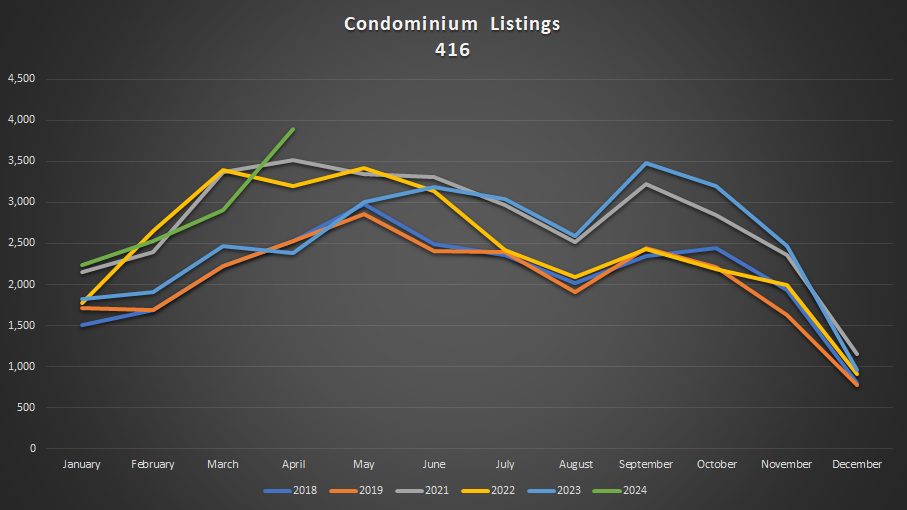
New condominium listings in the 416 are at a six-year high in the month of April.
This is after a month of March that saw new listings almost pull even with the busiest years on record: 2021 and 2022.
And just to say we did, let’s consider the 905 as well:
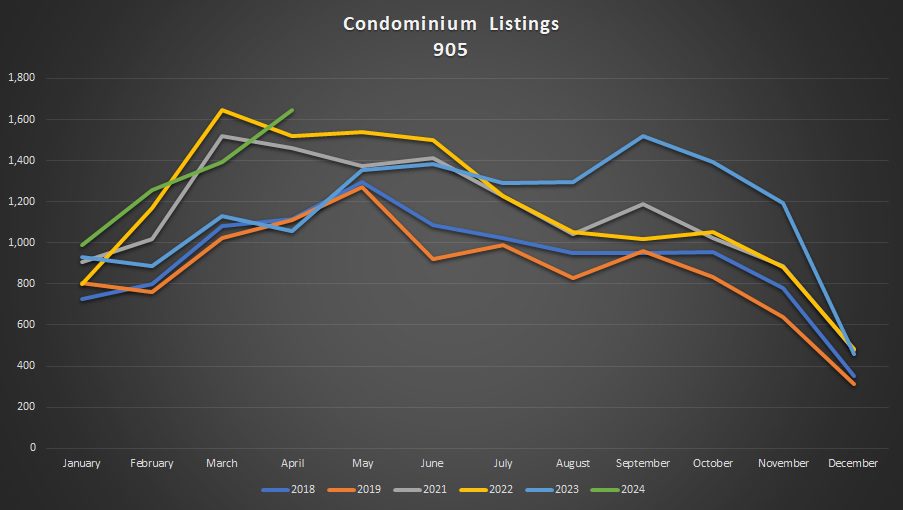
Same story.
Condominium inventory is peaking.
But where will that green line go in the month of May and beyond?
Well, if I can learn to set a calendar reminder or an alarm, I’ll be sure to update this feature in early July after Q2 is finished.
Wow, July.
I can’t imagine.
After the spring market is finished, when the kids are out of school, and when the weather is good.
I’m a summer person. Always have been. As a result, fall is my least favourite season.
Wow, Fall.
I can’t imagine.
What’s that real estate market going to be like?


London Agent
at 8:24 am
I will say, 2 blogs a week sometimes leaves me wanting more… also, as a summer fan myself, I am still a big proponent of the fall season, being that it still offers nice weather and beautiful colours. Winter was a childhood favourite but certainly falls last in the pecking order these days.
Igor
at 11:28 am
Good post, thank you. I’d appreciate David if you actually try to explain why softness in absorbtion rate hasn’t translated so far in price decline. I mean – that’s would be logically expected as you noted but for some reason hasn’t happened yet. Why is that? Is it a matter of time? Or maybe sellers are not willing to drop prices and are ok waiting for buyers to match their prices. Does it have anything to do with the CG deadline in June. I would be interested to hear your thoughts.
Thanks. Always appreciate your posts.
Derek
at 1:28 pm
One factor to note is that the “average price” is simply the total number of condos sold divided by the total sale price for all of them. It is not telling us what is happening with value of a specific condo. It is not telling us whether Condo B can sell for more in May 2024 than Condo A sold for in December (where both are in the same condition, with the same layout, and on the same floor). I would bet that David can indeed share his observations in the trenches as to how much equivalent condos are selling for, having regard to the recent months with modest absorption rates.
There is a tendency to confuse the concepts when average prices are positive, i.e., to invite the inference your specific property is worth more. But when average prices are negative, the tendency is to argue your specific property is definitely not worth less. I’m always comforted to know that although average prices declined as much as 20% or some such figure, from the peak, it doesn’t apply to my house; it’s just the average!
Your Favourite Tenant
at 2:47 pm
As someone who’s actively looking for a 1+ or 2 bedroom in this market… there is a lot out there, but a lot of it is trash. Tiny appliance walls with miniature appliances. Weird layouts. And they wouldn’t be cash-flow positive for an investor at current rents and interest rates unless said investor was putting down far more 20%. So if it isn’t appealing to someone who wants to live in it, and the numbers don’t work for an investor, it really becomes a matter of how bad does the seller need to sell? The nice units still sell, if they aren’t wildly overpriced. Which could account for the prices going up. But a lot of it just… sits. So when will desperate sellers start to take what they can get? And once one unit in a building gets sold cheap by a desperate seller, that’s the new comp for the building. Or will FOMO overtake buyers before that happens? But right now it feels like everyone is just frozen in place, waiting to see what happens next.