Tuesday, the new home sales report for March came in as a miss of estimates at 763,000, but the revisions were all positive, which shows that the housing data is still lagging behind the current market reality. That data shows how housing was still on pace to have another solid year before mortgage rates got over 5%.
The most recent housing starts data on permits and starts side of the equation was fine this month, but it also lagged the current rates environment. The housing world is much different at 5% plus mortgage rates versus the 3% mortgage world we had last year.
Housing data should cool off, and we are getting into the period where some forward-looking data reflects that. The new home sales market doesn’t have a 28% cash-buyer profile as we saw in the last existing home sales report. So, while cash buyers as a percent of sales have been growing, this sector is driven by mortgage buyers primarily.
From Census:
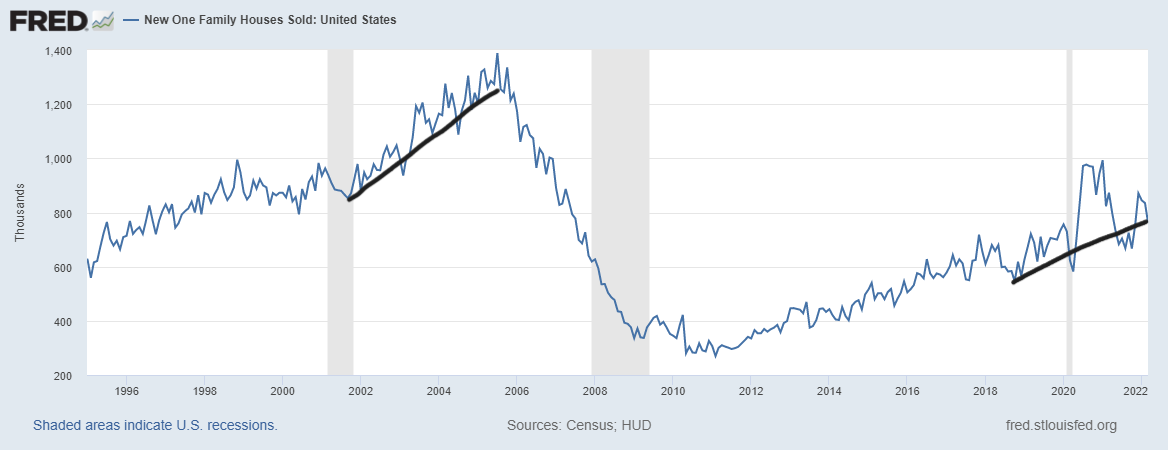
Sales of new single‐family houses in March 2022 were at a seasonally adjusted annual rate of 763,000, according to estimates released today by the U.S. Census Bureau and the Department of Housing and Urban Development. This is 8.6 percent (±12.9 percent)* below the revised February rate of 835,000 and is 12.6 percent (±11.3 percent) below the March 2021 estimate of 873,000.
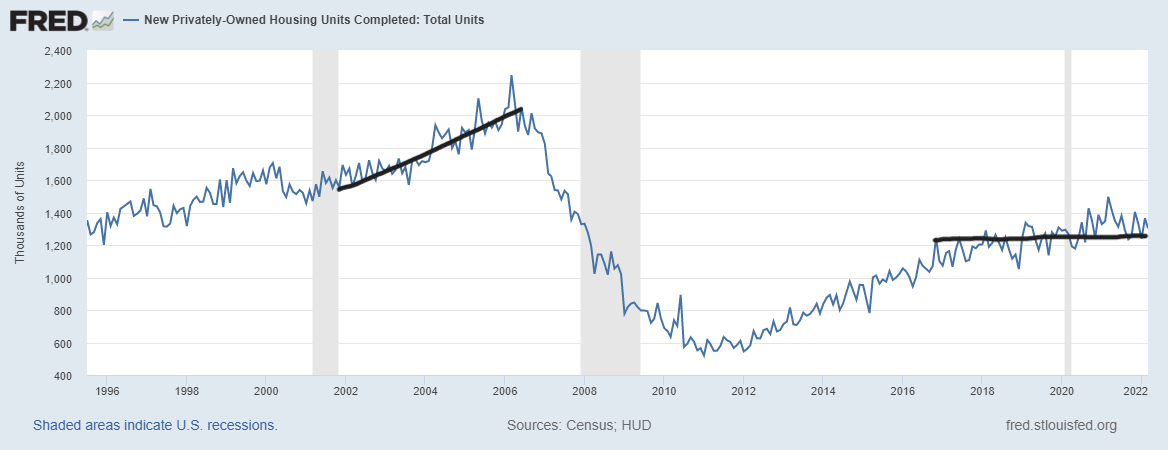
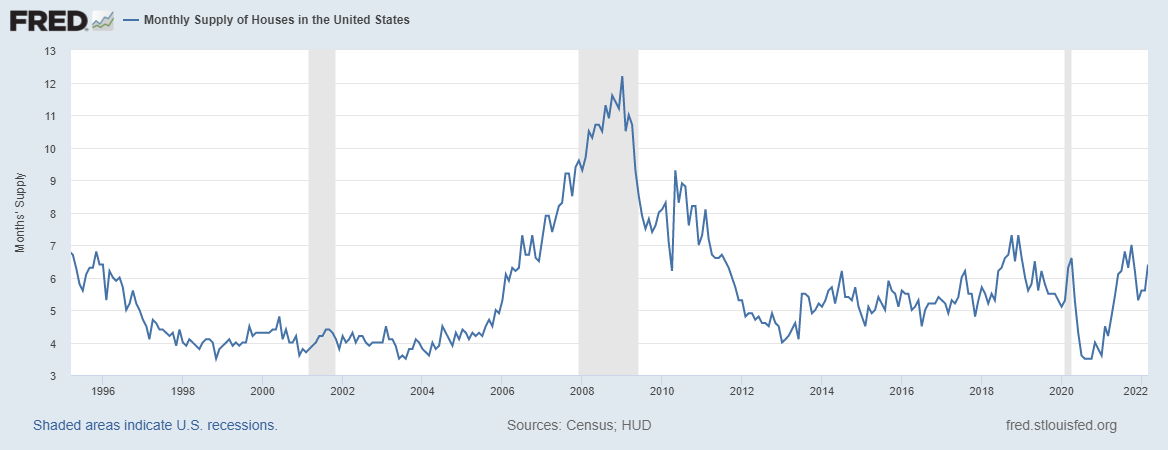
As we can see below, the uptrend in sales is still intact, so housing starts have held up OK. Even though multifamily construction has boosted housing starts recently, the slowdown in single-family purchases hasn’t been anything too dramatic yet. However, as rates move up, mortgage buyers of new homes will feel the pinch as new homes are always more expensive than existing homes in an apples-to-apples comparison. The one thing housing has going for it now is that we don’t have the speculative booming demand as we saw from 2002 to 2005.
From Census:
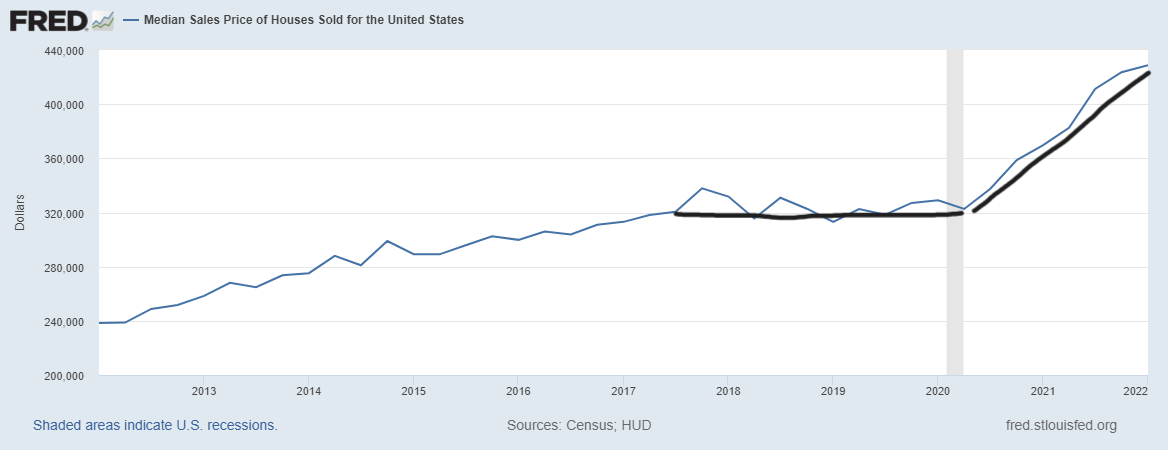
The median sales price of new houses sold in March 2022 was $436,700. The average sales price was $523,900.
Sticking with the theme of this year: the housing market is savagely unhealthy for both existing homes and new homes. The builders have pricing power and they — along with home sellers — have pushed it very hard since 2020. They were simply doing what the marketplace allowed them to do with low inventory and low mortgage rates.
The builders have to deal with an overhang of unbuilt homes, unlike the existing home sales market. For the rest of the year, we will see how much damage 5%+ mortgage rates have done with regard to cancelations. Builders have to find buyers for canceled homes, then think about their demand. The builders are always mindful of higher rates.
From Census:
For Sale Inventory and Months’ Supply: The seasonally‐adjusted estimate of new houses for sale at the end of March was 407,000. This represents a supply of 6.4 months at the current sales rate.
My rule of thumb for anticipating builder behavior is based on the three-month average of supply:
- When supply is 4.3 months, and below, this is an excellent market for the builders.
- When supply is 4.4 to 6.4 months, this is just an OK market for the builders. They will build as long as new home sales are growing.
- When supply is 6.5 months and above, the builders will pull back on construction.
Because the previous new home sales data was revised positively, the three-month average monthly supply is at 5.9 months. March’s headline number showed 6.4 months of supply. This is something I am keeping an eye on because two of my last three recession red flags have to do with new home sales and housing starts directly. So, went monthly supply spikes, the builders will pull back.
Single-family starts aren’t doing much right now, but multifamily construction is doing well. More weakness in new home sales will force the builders to pull back on construction of new homes on the single-family side.
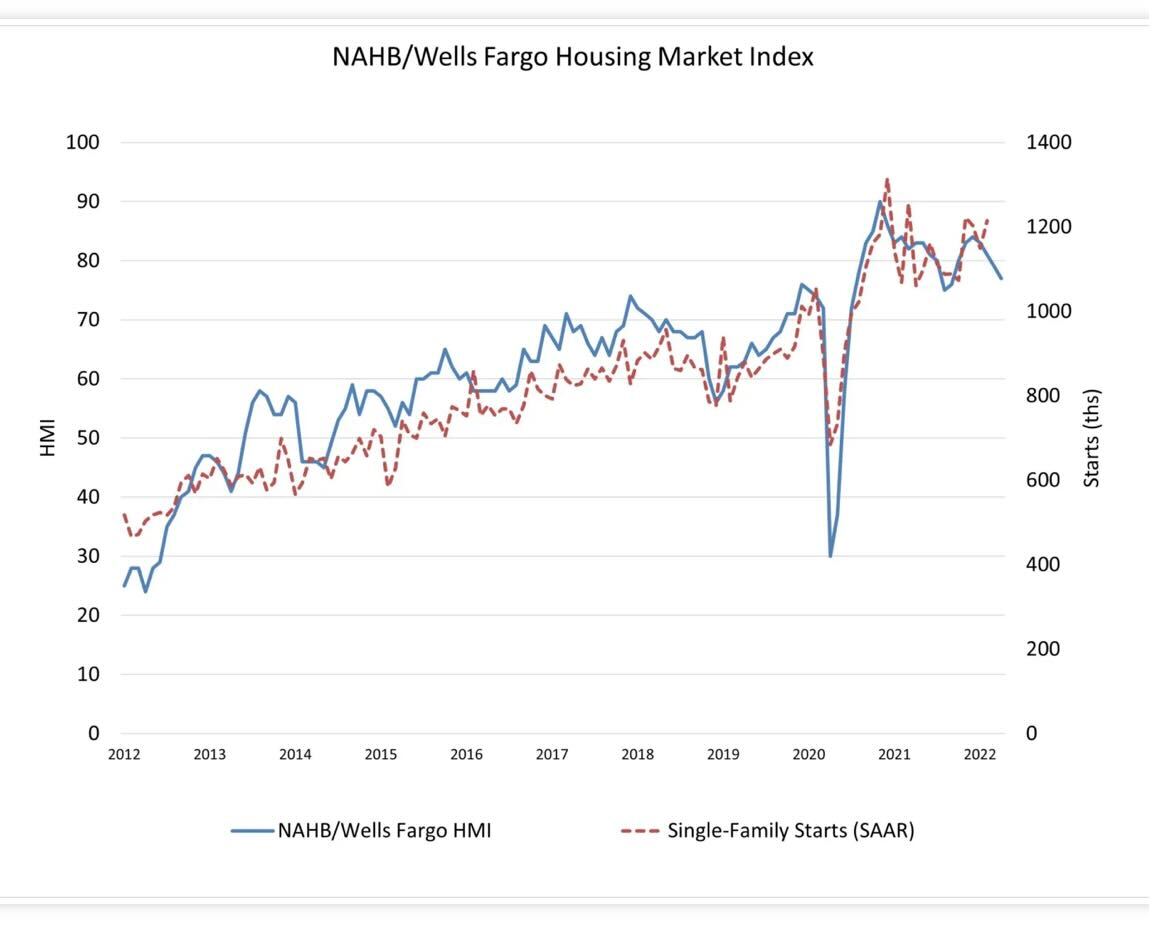
A good way to track the builders is through the National Association of Home Builders/Wells Fargo Housing Market Index (HMI), and you can see below that this year’s decline is more accurate than what we saw last year. Last year, COVID-19 created a demand surge, giving this index an unrealistic high level to work from. However, we don’t have that anymore, so the recent weakness in the builder’s confidence is legit.
From NAHB:
All in all, the new home sales report wasn’t bad because of the positive revisions, but to me, like other housing data, it’s lagging behind the reality of the world we live in today. Mortgage rates have spiked faster than usual, and some of the data we have been reporting on hasn’t had the duration impact of higher rates. So, going ahead, we will see the real impact of higher rates.
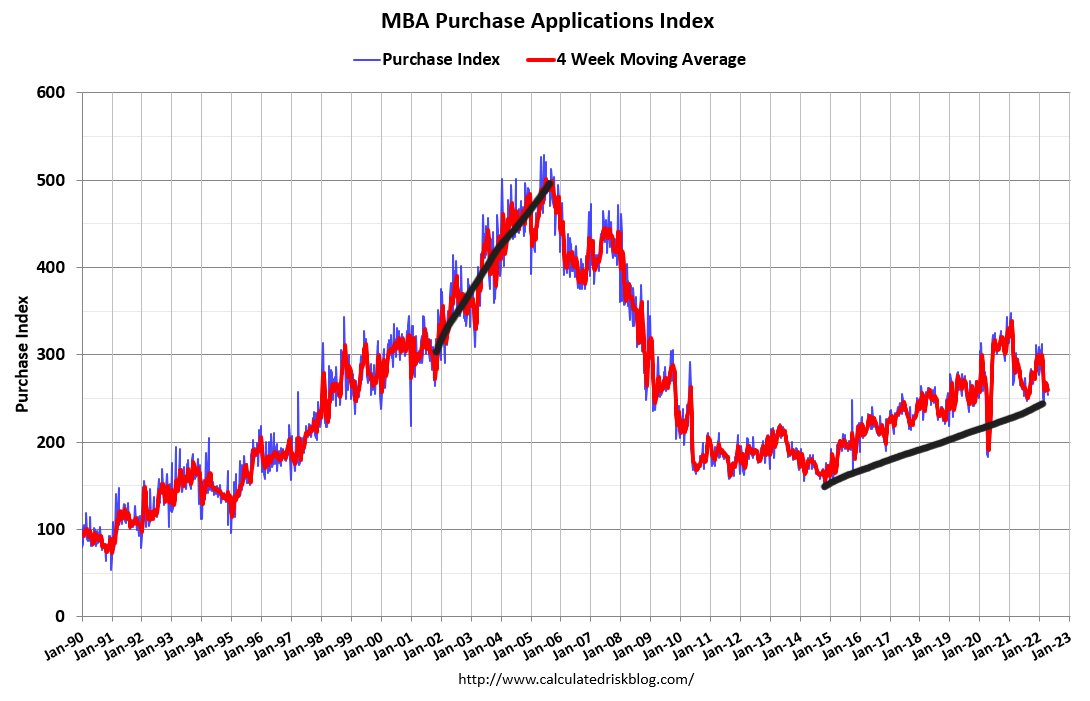
We have seen the MBA purchase application data show weakness this year, but nothing too dramatic yet. In 2014 we had a 20% year-over-year decline trend. In 2018, we had three mild negative year-over-year prints. Currently, the four-week average is showing a -9.75% year-over-year decline. It will be prudent to keep an eye out on the year-over-year data trends more than the week-to-week data.
Going forward, I will keep a close eye on the builders to see if they will be cutting back on housing construction as new home sales fall. This by itself will raise a recession red flag. One thing to remember, the last two times rates rose and the builders got impacted, rates, later on, fell to help the builders out.
If bond yields and mortgage rates fall more noticeably, the builders should have a more positive outlook. This isn’t the case now, but it’s something to look at if economic growth gets weaker.