Almost three months ago, I wrote that based on the year-over-year growth in purchase applications, the housing market should have a few existing home sales under 5,840,000. At the time, I said:
“The rule of thumb I am using for 2021 is that existing home sales, if they’re doing good, should be trending between 5,840,000- 6,200,000. This, to me, would be considered a good year for housing. This also means that we should have some prints above 6,200,000 like we have had already and below 5,840,000, which hasn’t happened yet. We ended 2020 with 5,640,000 existing home sales which was only roughly 130,000 more than 2017 levels.”
The year-over-year comps for 2021 are a mess because COVID-19 made the 2020 data so crazy. This just means we need to make some adjustments in the data to account for COVID-19. The existing home sales data is one area where adjustments are necessary.
The parabolic move in sales last year was due to makeup demand for the shutdown months when sales were frozen. The parabolic sales of the 2nd half of 2020 were just a makeup demand. People are getting confused by the fall from this peak, but this is to be expected.
Remember, total existing-home sales ended 2020 at 5,640,000. That was pre-cycle highs in demand, but not a blowout as this was only 130,000 more than 2017 levels. Every single sales print this year has been higher than where we ended 2020. Today’s 5,800,000 existing home sales print is slightly better than I thought it would be.
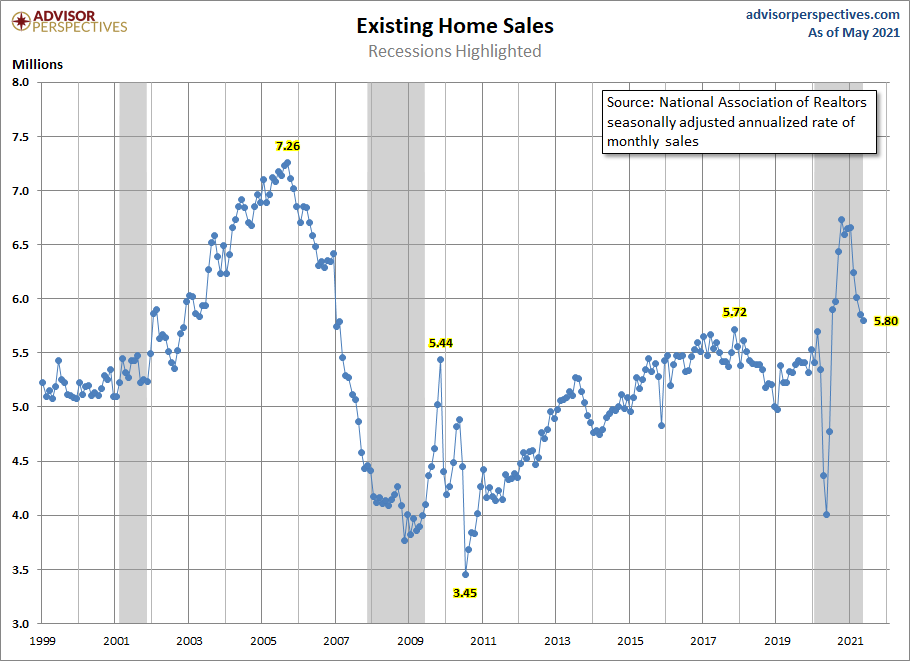
According to the National Association of Realtors, total existing-home sales, completed transactions that include single-family homes, townhomes, condominiums, and co-ops, dropped 0.9% from April to a seasonally-adjusted annual rate of 5.80 million in May. The housing market’s existing sales in total climbed year-over-year, up 44.6% from a year ago (4.01 million in May 2020).
For your sanity, I recommend abiding by my rule to ignore all year-over-year data for 2021. We likely will need to extend skipping the year-over-year data into the early parts of 2022 as well for the same reasons. As you can see below, the year-over-year growth is absurd but only due to the low COVID-19 comps.
I am looking for (i.e., hoping to see) the days on the market to increase. If this doesn’t happen, then we cannot expect home price growth to moderate. My greatest fear for the housing market for the years 2020 to 2024 is that home price growth would escalate. As purchase applications increase, total inventory falls. This causes an inventory crunch, which leads to home price growth without significant change in demand. Currently, the days on the market are simply too low. Americans make enough money to buy homes, but price growth is more robust than it should be.
If days on market would just get back to 30-plus days then total inventory levels could get back to early 2020. We have the highest number of Americans of home-buying age at a time when inventory is our biggest problem. I feel for all those folks out there who are ready to buy and just want a place to live but are forced to play hunger games to get home.
I anticipated that during this period of 2020 to 2024, when our demographics were solid for home buying, as long as we had up to 23% in cumulative nominal home price growth, we would be ok. Adjusting to inflation, that level of price growth would be manageable with rising wages. But it is not so manageable that we are already seeing this much price growth in the first two years. The two-year growth trend will surpass my 5-year outlook.
We aren’t experiencing a credit boom. Instead, we have a solid supply of replacement buyers coming in each year, higher than what we experienced from the years 2008-2019. As you can see below, purchase application data from 2018 to 2021 looks nothing like what we saw from 2002-2005 during an actual credit boom. Our demographic is giving us built-in replacement demand for shelter. When this massive group of 27- to 33-year-olds is added to our baseline numbers of move up, move down, cash, and investor buyers, we have many people who need a place to live or want to own a home.
If you happen to listen to one of the many housing bubble crash trolling groups that are clogging up the internet again, be mindful of one of their favorite gimmicks. They assume that you don’t know about the seasonality in purchase applications. They will trick their listeners into believing that housing demand is collapsing because the June number is falling.
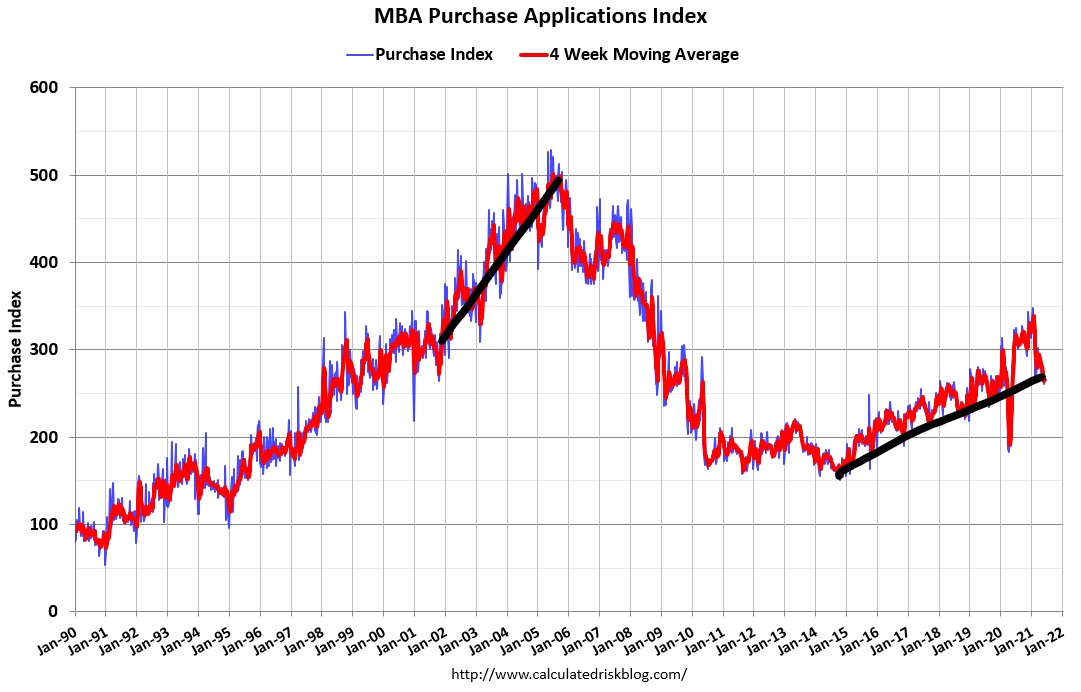
What they decline to mention is that the total volume of purchase applications falls after May every year. This is called seasonality, and it is perfectly normal and expected in our housing market. The only time we didn’t have a drop after May was in 2020 because we were in the COVID-19 rebound. This trick is pulled out every June to prove some fundamentally flawed thesis for why housing is about to crash. You may even hear that home sales are plummeting, even though the home sales print this year was higher than the total sale in 2020. Just give this nonsense the smirk it deserves and move on with your life.
This data in this report looks just as I would expect it to, maybe even slightly higher. I anticipate a few more prints under 5,840,00 but no dramatic drops. We are on-trend to have 2021 sales slightly higher than 2020 total sales. In the years 2020-2024 in housing, we should see 6,200,000 total home sales ( New + Existing) every year.
If this doesn’t happen, then something unexpected happened. This may be that home prices escalated out of control, and then when mortgage rates rise, it created enough hit on demand to bring total sales below this level. This will not be the story for 2021. Still, the price gains in 2020 and 2021 should raise eyebrows, especially since we do not see much growth in credit. As long as this scenario continues with days on the market at the teenager level, I will still call this the unhealthiest housing market post-2008.