
Home flipping rose in 2017 to its highest level since 2006 and the percentage of flips using financing also reached a nine-year high.
The percentage of flips completed with financing could signal more interest from real estate investors as the lending market for fix-and-flip real estate investors matures with competitive interest rates that more closely resemble buying with cash.
This maturation of the flipping market, coupled with rising home prices, means real estate investors who want to expand their portfolios with multiple simultaneous purchases and may not have enough cash to fund all the transactions they desire might be turning to financing to help expand their portfolios.
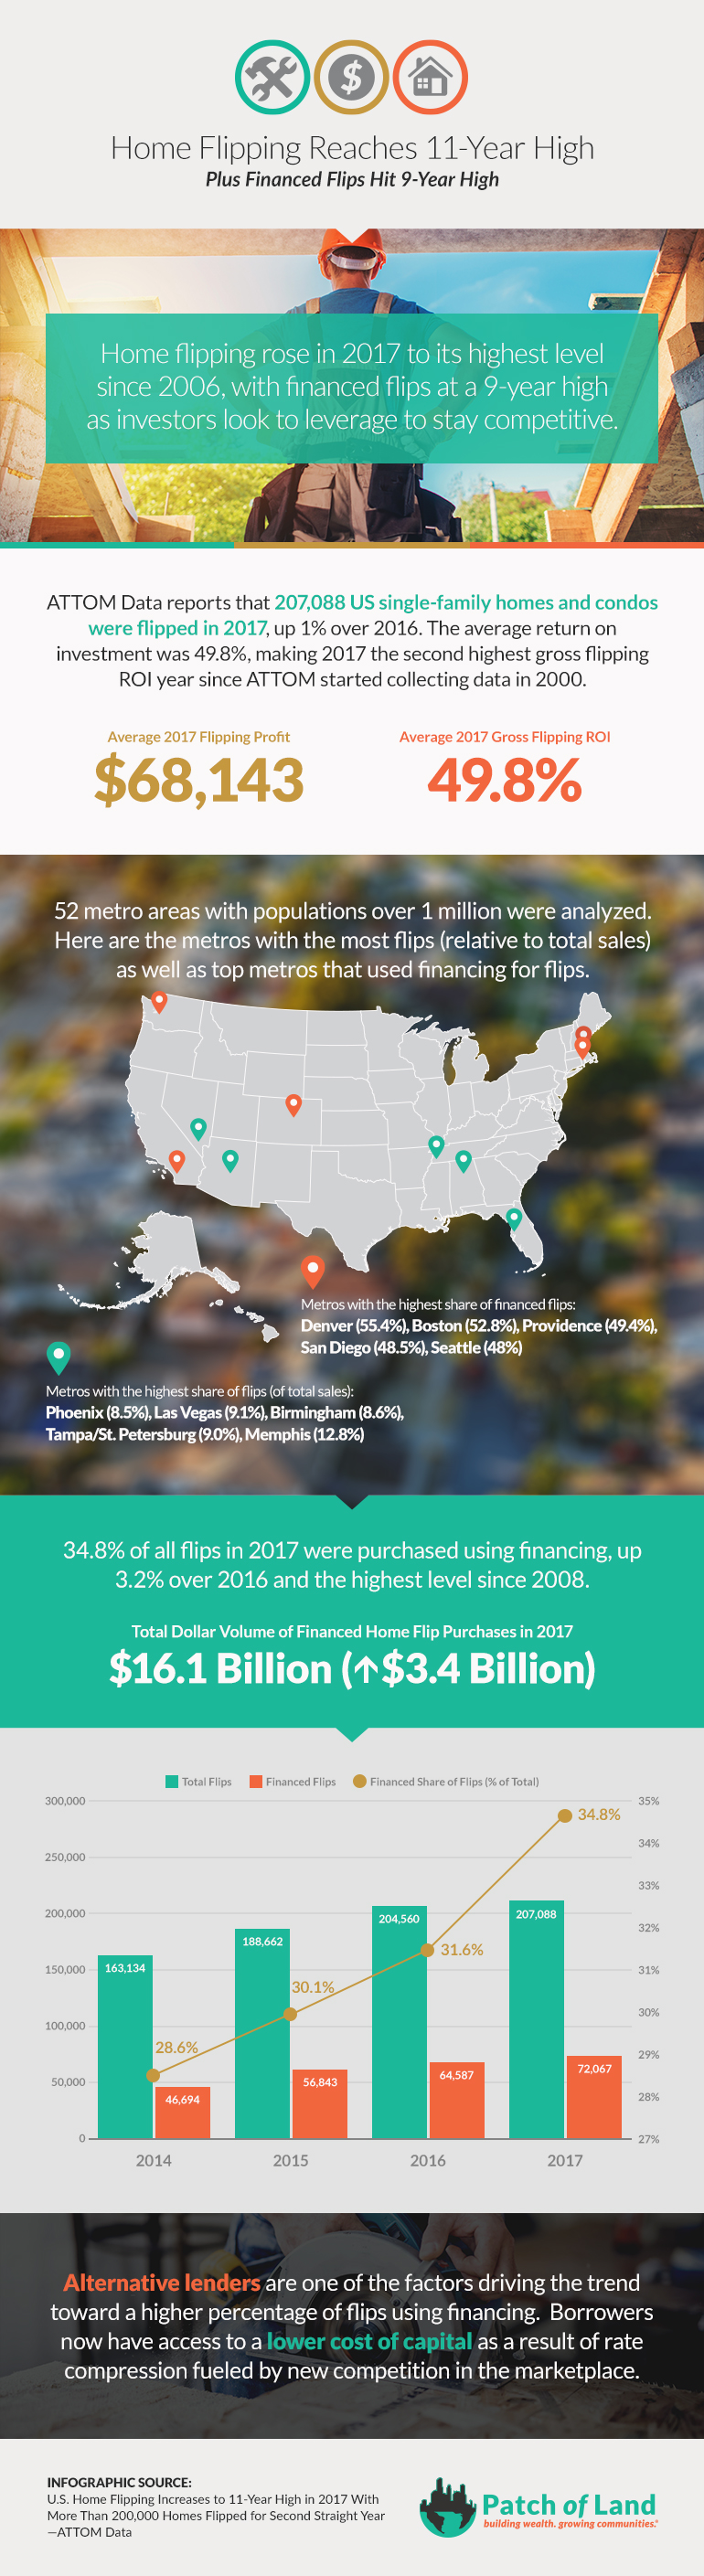
ATTOM Data reports that 207,088 U.S. single-family homes and condos were flipped in 2017, up 1% over 2016 numbers. They report that 34.8% of flips last year were completed with financing, a significant increase from 31.6% in 2016.
Over One-Third of All Flips Purchased with Financing
Flips purchased with financing were at their highest level since 2008. This nine-year high comes as crowdfunders and online lenders like Patch of Land cater to a market that has been largely ignored by traditional lenders and big banks.
The total dollar volume of financed home flip purchases reached an 11-year high in 2017 — $16.1 billion, up from $12.7 billion in 2016, and the highest since 2007. The days where cash is king certainly aren’t over, but financing flips continues to attract a larger share of the total market.
Among 52 metropolitan statistical areas with at least 1 million people that were analyzed in the report, those with the highest percentage of flips purchased with financing were Denver (55.45%); Boston (52.8%); Providence, Rhode Island (49.4%); San Diego (48.5%); and Seattle (48%).
Average Gross Profit from Flips Near All-time High
There is plenty of good news for real estate investors in the report. The average gross flipping profit of $68,143 in 2017 provided an average 49.8% return on investment, the second highest gross flipping ROI since ATTOM began collecting data in 2000. The average gross profit in 2017 was just slightly off from the all-time high average reached one year earlier (in 2016), with a 51.9% percent return.
Among the larger metros (with populations of more than one million), Memphis (12.8%), Las Vegas (9.1%), Tampa/St. Petersburg (9.0%), Birmingham (8.6%), and Phoenix (8.5%) registered the highest number of flips relative to total home sales. Of this same group, the best returns were found in Pittsburgh, Philadelphia, Cleveland, Baltimore, New Orleans, Cincinnati, and Buffalo, all reporting ROIs of over 80%.
Among the smaller markets, Pennsylvania had four of the five markets showing investors the best returns. The top five smaller markets were Scranton, Pennsylvania (168.2%); Pittsburgh, Pennsylvania (145.5%); Baton Rouge, Louisiana (122.9%); Philadelphia, Pennsylvania (115.7%); and Erie, Pennsylvania (114.1%).
Addressing Challenges
The low levels of inventory in many markets coupled with rising home prices will continue to challenge real estate investors, potentially affecting the number of flips as well as profitability.
One of the factors driving the increase in flips completed with financing is the impact that alternative lenders are having by providing borrowers access to lower cost capital by providing more competitive rates. In addition, the maturation of the flipping market suggests that flippers who want to expand and may not have enough available cash to fund all the deals they want to do are now turning to financing.
At Patch of Land, the majority of our customers are experienced flippers and we are seeing an increase in the number of borrowers coming to us for financing. We are seeing some investors that previously had success completing only one or two flips per year are now wanting to do 5 to 10 flips a year, but they need financing to help fund the acquisition of more projects, some of which are going on simultaneously.
The report also noted that flips to FHA buyers dropped to 17.6% in 2017 from 19.4% in 2016 with some speculation that flippers are opting to buy/flip/lease and then sell back to real estate investors interested in holding property as single-family rentals.
Click here to download the infographic.
 ABOUT THE AUTHOR
Robert Greenberg is the Chief Marketing Officer at Patch of Land responsible for branding, corporate communications, lead generation and managing the integrated marketing activities. His background includes over 25 years in marketing working with familiar consumer brands such as Pepsi-Cola, Anheiser Busch and Sara Lee as well as B2B experience in retail, technology, finance, and real estate.