
On Monday night, a 2-bedroom condominium in Liberty Village, listed for sale at $599,900, solicited twenty-one offers and sold for $715,000.
If you’re not impressed by the sale-to-list ratio, that’s fine.
But with respect to the number of offers, dear friend, are you not entertained?
Last November, I had a listing for sale in the same building.
The unit was previously tenanted, and my client took my advice and cleaned it, painted it, staged it, and we put it on the market.
(crickets)
Listed at $549,900, we actually received an offer for $460,000. I wrote about this on my blog last year as there was one of those “letters to the seller,” which was so incredibly misplaced as it was submitted with the lowest offer I have seen in my entire career. We had very few showings on this condo, and eventually, showings just stopped. An offer appeared out of nowhere, and my client sold for a few thousand dollars under the list price.
That was November.
We are in February.
Three months. That’s all it took for the condo market to completely turn around: three months.
We went from not getting showings on condos to getting twenty-one offers.
I wrote about this quite a bit last month and into February as I regaled you all with stories about the “red hot” condo market. A few of the readers in last week’s post called me out and asked if the market was really all that hot.
I mean, twenty-one offers on a condo can’t be wrong, right?
So now that the January TRREB stats have been released, I can finally put a number to this incredible surge in the condo market.
The average 416 condo price in December of 2020 was $625,828.
And now that the condo market has exploded in 2021, I’m pleased to inform you that the average 416 condo price in January was……………………..$624,886.
Wait.
What?
That can’t be right. Let me double-check…
…hmm, still $624,886.
Let me refresh my screen.
Let me ask my colleagues if the error is displayed on their computers as well.
Let me call TRREB help desk. Oh wait, they’re useless anyways, but I digress…
Folks, when you’re wrong, you’re wrong. And I’m dead-wrong here, as the numbers suggest! But based on what’s happening out there, there simply must be an explanation.
There is absolutely, positively, no way that a condo in the downtown core would sell for more in December than in January. Surely we can agree on this? Surely you can trust what I’m seeing and experiencing out there in the market?
At the risk of trying to find numbers to justify my view, let’s look at the following…

No matter how we look at the January data, there’s not a single figure that backs what I’m saying about the condo market.
So as I said, you can choose to trust my judgment on this, or not. I won’t be offended if you don’t trust me.
But I can’t make sense of the data here. The stats just haven’t caught up to what’s happening in the market.
I chose to open today’s blog with the average condo price, but there are a few other metrics I plan to discuss:
Condo Sales
Overall Sales
Inventory
Sales-To-New-Listing Ratio
Prices
So let’s get ‘er going…
I wrote in this space last month that December condo sales outpaced November for the first time ever. Here’s that stat again:
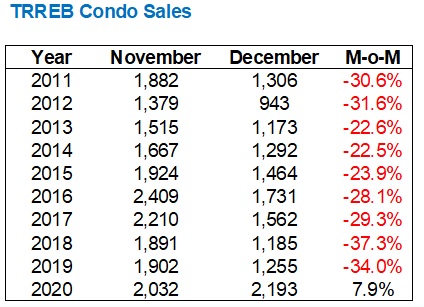
That’s a really, really tough chart to not draw conclusions from, and I think we all realized that condo sales (and prices?) were on the upswing after viewing this chart.
It’s just too much red to ignore, and the outlier is quite obvious.
If we were talking about seeing drops of 3-5%, and then a 7.9% increase in 2020, then maybe we could call it a “blip” on the radar. But we have routinely seen a drop in sales around 30% from November to December, and all of a sudden, we see a 7.9% increase in 2020.
That’s saying something.
So how does this chart look if we repeat it for December-January?
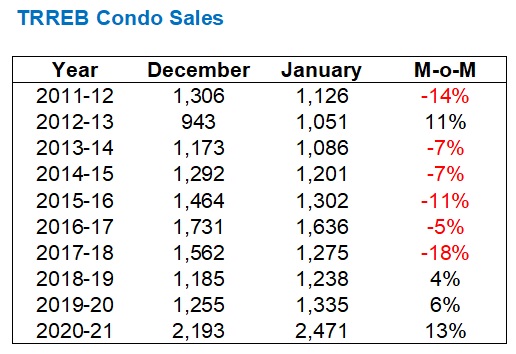
Not quite the same pattern, but important nonetheless.
For only the fourth time in ten years, condo sales have increased from December to January, and by 13% which leads the pack.
But more importantly, the 2,471 condo sales in January is the highest number ever. That’s on the heels of the most ever in December as well.
While the average condo price in the GTA and/or 416 may not be showing us what we’re feeling out there in the market, the sheer number of condo sales certainly does.
So what then of the overall market? How do total sales look?
Well, once again, it was a record-setting month:
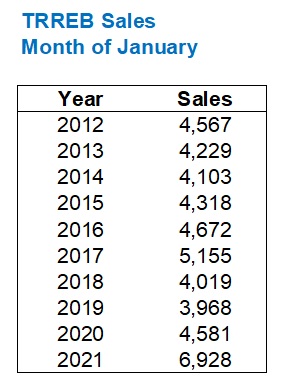
This wasn’t just the most sales ever recorded in the month of January, but rather an absolute annihilation of the previous record.
That’s a 34.4% increase on the highest-ever number of sales in January, and 57% higher than the average of the previous nine years.
Any way you choose to look at sales this past month, we’re seeing records.
Now, if there were more listings available, there would certainly be more sales!
That sounds elmentary, right? It sounds obvious?
I’d like to share with you two screen-shots of emails in my inbox right now as I write this on Tuesday afternoon.
Here’s one:
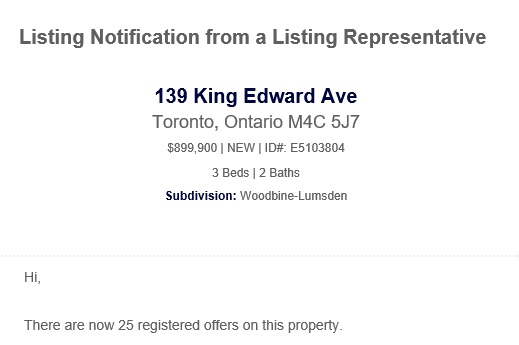
Oh, sure.
Only twenty-five offers? That’s it?
Well, I believe there were twenty-nine in the end, but who’s counting, right?
We lost that offer. It’s not official yet, but when you know, you know.
But that’s the east side.
How about the west side, you ask?
Here’s another property I’m bidding on:
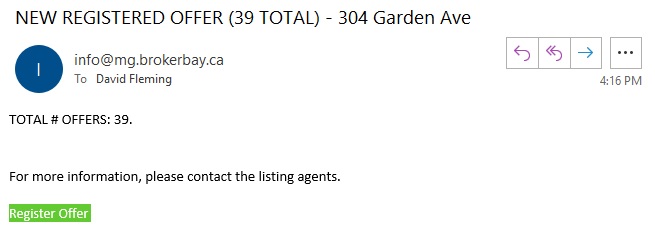
LOL
What – they couldn’t crack forty?
So with 29 offers on one property and 39 on another, what does this say about the market?
You’ve all heard this before, right? It’s low inventory!
Every property-owner out there seems to think, “I don’t want to list during a lockdown. Nobody will view my home!”
Tell that to my colleagues at 10 Fennings Street who had 175 individual showings booked during their one week on the market.
So what happens when low inventory meets high demand?
Here’s a chart you simply will not believe:

Some of you know exactly what this says after a half-second glance.
Others will need the explanation, so here goes…
Sales figures on their own may mean one thing, or another, depending on inventory.
And inventory could be high or low, on a relative basis.
What makes prices go up and down is the relationship between buyers and sellers, supply and demand, and as is noted above: sales and listings.
The “Sales to New Listings Ratio” or SNLR is essentially the rate at which listings are selling, and while it’s not the exact new listings that are selling, we are looking at the number, and comparing it to the sales.
This is one of my favourite market indicators, and some people will look at the inverse, or “Months Of Inventory” (MOI), which is basically the same thing.
As you can see above, the SNLR for January was 73%, which doesn’t mean much to you on its own. But when you compare to 2020, we see that it sails past the 58% SNLR we experienced in what was a very busy January of 2020!
Once you read through the whole chart, you realize that the SNLR is the highest it’s been in January, at least this past decade.
My yellow highlights are to illustrate that the SNLR is even higher than in January of 2017, and for those of you who have been reading this blog for four years or more, you all remember what happened in January of 2017: prices took off and we saw a 25% appreciation in four months.
If you had told me that, coming into 2021, inventory would be tighter than in 2017, I wouldn’t have believed it. And yet, here we are.
Now the above SNLR is with respect to the entire market.
What about condos? You know, that part of the market that I say is on fire, with prices rapidly rising, even though the stats don’t align?
Check this out:
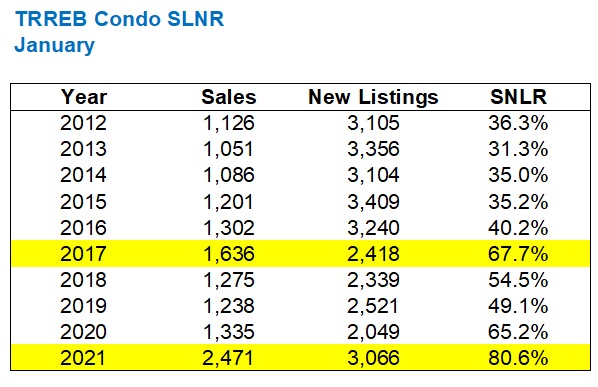
In the GTA condo market, the inventory is even tighter!
A sales-to-new-listings ratio of over 80%, when the previous nine years averages 46.0%.
With the entire GTA market, we saw the 2021 SNLR beat out 2017 by 3%.
But in the GTA condo market, the 2021 SNLR beats the 2017 SNLR by a whopping 12.9%.
Price may not have caught up, on paper, to the stats we’re seeing out there in the market, but the tightness of inventory sure has!
Of course, average sale price is the last peice of the puzzle, and while January of 2021 didn’t set a new record, it shouldn’t be expected to. After all, there has never been a truly “record-setting” January. THe month of January usually results in a depressed average sale price, and we’ve actually never seen a January price that’s higher than the highest month in the previous calendar year. We almost broke that streak last month:
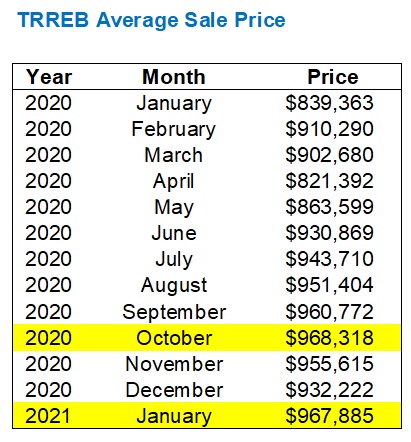
We came within $433 of the record average home price set in October of 2020.
In January, of all months.
And what typically happens with average sale price in February, March, April and beyond?
This:
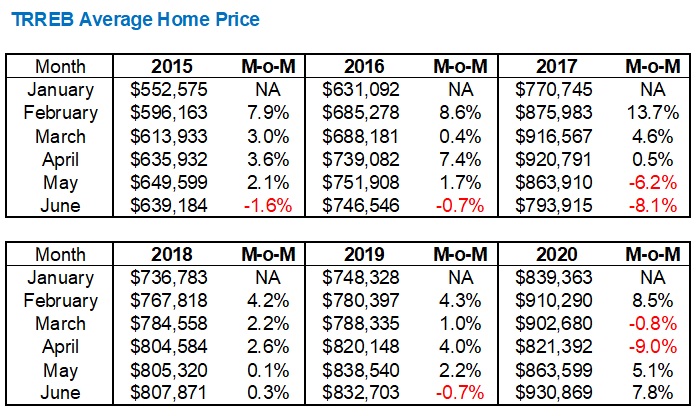
Save for 2017, when the government tanked the market, and 2020, when we had a worldwide pandemic, we’re fairly accustomed to seeing average home price rise throughout the spring and taper off in June.
But look at the increases from January to February: 7.9%, 8.6%, 13.7%, 4.2%, 4.3%, and 8.5%.
Even if we “only” saw a 4% increase in average home price this February, that would bring the $967,885 price from January up to to $1,006,600.
Is it going even higher this February?
Or are we about to see the lowest January-to-February increase in average home price in six years or more?
I’ll take the former.
And you?


Christopher
at 6:56 am
Do you have access to the number of 1 bedroom and 2 bedroom condos sold? Perhaps there is an increase interest in smaller condos which is keeping the average price down.
Appraiser
at 8:42 am
“Sales are ramping up. Condos in particular – the rolling 30 days of sales are 21% above the weekly peak from last year – and we’re in early Feb! So market getting tighter, especially so in condos, with MOI now below Freeholds last couple of weeks. First time in 10 mos.”
https://twitter.com/areacode416?ref_src=twsrc%5Egoogle%7Ctwcamp%5Eserp%7Ctwgr%5Eauthor
Chris
at 9:06 am
“The Canadian labour market shed over 200,000 jobs in January, far worse than expected… You know what this means, house prices are going higher. I’m half joking, of course, but it seems the worse the economic fundamentals, the higher house prices seem to go right now.
The worse the numbers, the more stimulus will keep coming. Make no mistake, housing is going up based on liquidity, not economics.”
– Steve Saretsky
“Most of the time governments don’t want housing bubbles. They get alarmed when prices are rising by 30%y/y.
This time is different. They’re supporting it on the way up and will do everything possible to prevent prices from falling”
– John Pasalis
“Stocks extended their weekly rally after weaker-than-forecast U.S. jobs data bolstered the case for President Joe Biden’s $1.9 trillion coronavirus relief package.”
– BNN Bloomberg
Not sure how anyone can say with a straight face that prices of real estate, stocks, Bitcoin etc. are the result of natural supply and demand. It’s glaringly obvious that all are benefiting from extremely loose monetary and fiscal policy.
We bicker about stocks vs real estate, as both are pushing to new record highs on the back of government-funded supports. Great for portfolios, but I’m not sure how sustainable it is.
Appraiser
at 9:35 am
Saretsky and Pasalis on their own, are barely tolerable.
Together they are incoherent.
And those that believe that people on emergency government financial support programs (see unemployment numbers) are the same people buying stocks and real estate are living in a different universe.
(p.s. define ‘sustainable’.)
Chris
at 9:53 am
Ah, there’s the classic appraiser line. No need to rebut their points, just yell “incoherent!” in dismissal without any explanation. Tres convincing.
“And those that believe that people on emergency government financial support programs (see unemployment numbers) are the same people buying stocks and real estate are living in a different universe.”
Strawman argument. Nobody has postulated that.
Do you truly still only know about CERB? We’ve talked before about CEBA, CEWS, TEWS, and other fiscal stimulus provided by the federal government. If you think it’s only the destitute and unemployed benefiting from fiscal largess, you’re sorely mistaken.
https://financialpost.com/investing/fp-investigation-as-cews-flowed-in-dividends-flowed-out
And this is to say nothing of monetary policy, such as the Bank of Canada’s swollen balance sheet, pinning interest rates to the floor.
Once again, if you wish to believe real estate is being driven purely by supply and demand, and not impacted by stimulus or policymakers, fill your boots. But then I would expect you to hold the same opinion towards the stock markets as well.
So, are stock prices breaking records on organic supply and demand?
Chris
at 10:51 am
p.s. on the “sustainable” aspect:
“I cringe every time I see someone look at 25% annual house price growth and proclaim on Twitter: “This isn’t sustainable” – oh you think?
If the average GTA price is $1M in 2021 and increases by 25% per year, the average price would be $9.3M in 2031.”
– Ben Myers
I don’t commonly find myself agreeing with Ben, but I’m aligned with his opinion on this one.
Just as unsustainable is the pace of appreciation of the S&P500 and NASDAQ, at 17% and 46% YoY, respectively.
Sirgruper
at 11:34 pm
Isn’t the reality that money loses value and that stores of value whether stocks or real estate must rise over time. The only terrible investment over time is cash. As such Chris and Appraiser will both be right over the long term.
Chris
at 8:26 am
Inflation should make that true. I think over the long run both stocks and real estate, and most other assets, will climb in value, if only because the purchasing power of a dollar erodes.
I’m more concerned that the current pace of asset appreciation is very rapid, despite relatively low inflation as measured by CPI.
Edwin
at 11:19 am
I don’t understand how the condo market could do a complete 180 in 1-2 months and absorb all that excess supply so quickly. All while rents are still severely depressed. What happens if some of the thousands of units that were terminated from Oct-Jan start coming back?
Pragma
at 11:26 am
The other way you can frame it is that you had the most bullish market conditions ever in terms of low inventory and high sales and yet prices managed to do nothing. How do you reconcile that? So what will happen going forward? Is that SNLR ratio going to go higher or lower?
Nick
at 11:26 am
Hi
The condo you mentioned in your article in liberty village selling for $715,000 is actually a 2 bedroom not a 1 bedroom that makes a difference.
Condodweller
at 1:23 pm
Whomp (there it is)
David I think you’ll remember this one from your clubbing days….
https://youtu.be/ffCEr327W44
I was going to go look up the size of the unit but Nick saved me the trip.
David Fleming
at 3:14 pm
@ Condodweller
“Whoomp There It Is” was released when I was in Grade Eight, so not quite my clubbing days, which began in 1999. Songs from the clubbing days were more like “Rendezvous” by Basement Jax, “My Feeling” by Junior Jack, “The Launch” by DJ Jean, a song by ATB with a title too racy for this blog, and who could forget “Better off Alone” by DJ Jurgen?
That was a typo, I swear. I know it’s a 2-bed, 2-bath condo because our client had an offer on it. Whoops………there it is…
David Fleming
at 3:16 pm
Also:
https://www.youtube.com/watch?v=Mu0cE9RgK5M
I just got a flashback to second-year university. I finished my statistics exam and drove my father’s Honda Accord home along the QEW, playing this song, and contemplating life. 20-years-old was a tough age…
Marty
at 5:09 pm
Oh ya, Better Off Alone is a great song.
Condodweller
at 12:22 am
Well that was quite the red herring. The numbers make sense again then.
Libertarian
at 9:57 am
Club music from the 90s is the best! My favourite of which is house music. Ahh, the good old days!
Ryan Roberts
at 5:30 pm
Nice work, Fleming. Good post as always!