
This is an example of the hysteria being whipped up by the pseudo-experts. They tend to grab fake data, jump to conclusions, and then spread it everywhere.
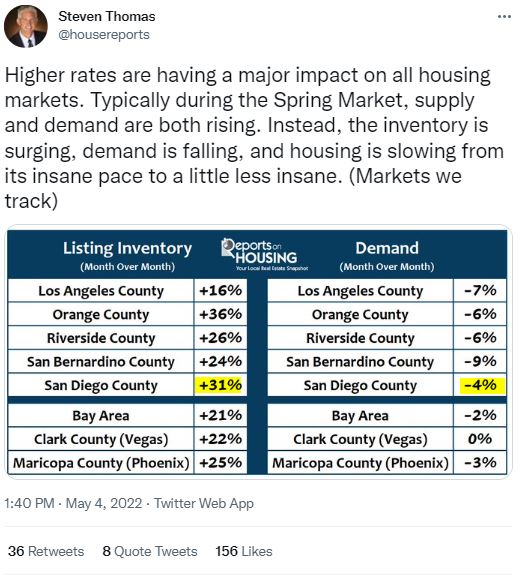
Here is the tweet with comments – he says the +31% is the change between March and April:
https://twitter.com/housereports/status/1521952871490621440
I don’t know where he gets his information, but it isn’t from the MLS:
Listings & Sales, Monthly
| Location | ||||||
| SD County | ||||||
| NSDCC Detached |
He says the San Diego Listing Inventory surged +31% between March and April, when it actually dropped on the MLS. Why would he say that? I don’t know, but he sells his data now so that may have something to do with it.
I don’t know how he is measuring ‘demand’, but the San Diego County sales did decline 6% between March and April. But look how close the sales count is to the listing count – we are selling practically everything that comes to market, for pete’s sake. If the listings decline, so will sales.
Is he talking about the active listings?
This is how it looks on InfoSparks. The M-o-M change is +7% (last year was +5%), and the actual count of 2,616 active listings in April is bleak compared to previous years (12,652 in April, 2019!):
None of the facts are suggesting an inventory surge in San Diego County. We would welcome one!


