
The reason for breaking down the active and pending listings by zip code is to give the readers a closer look at their neighborhood stats.
The number of pending listings is almost the same as the number of actives. It’s feasible that their paths could cross again in the coming weeks as the unsuccessful sellers cancel their listings for the holidays:
NSDCC Active and Pending Listings
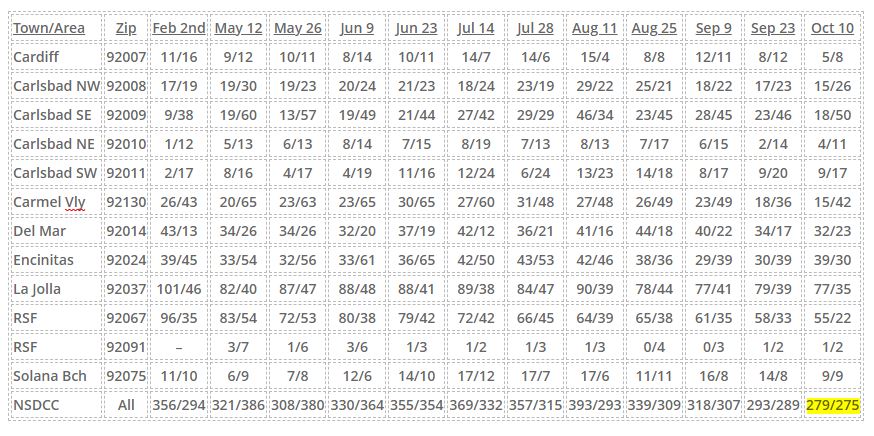
But with fewer homes for sale combined with the time of year, we probably won’t see much change. Let’s call it low-grade frenzy conditions for now.
How about the average days on market?
Some of the high-enders have been hanging around a while, but the rest are moving!
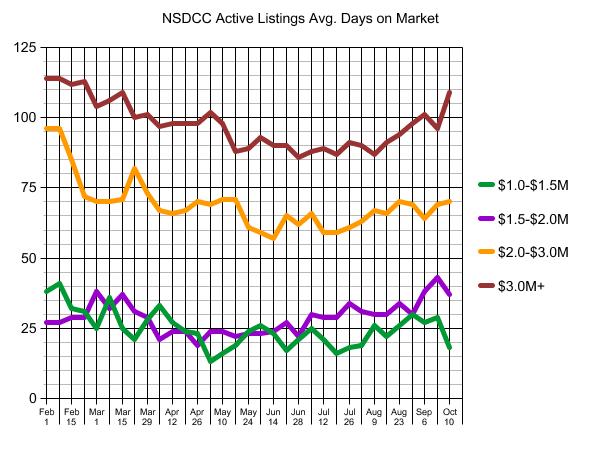
It’s fascinating that the average days-on-market for ALL pendings is 33 days, and the median is 16 days. For those 65 pending sales over $3,000,000, the average DOM is 54, and the median is 43 – it doesn’t take months to sell in this market.


