
What would you do if you knew absolutely nothing about real estate but really, really wanted to learn?
Where would go turn to?
Would you ask your parents for insights?
Would you read the Toronto Real Estate Board’s press releases?
Would you read some random real estate agent’s biased blog?
Would you find any and every real estate-related article in the major newspaper?
I suppose I had never really thought about how a completely novice, uninformed individual would start to educate him or herself, and where they would turn. In 2021, we all suffer from information overdrive, but the larger problem is that the sea of difference between “fact” and “opinion” seems to be shrinking.
On Thursday of last week, I went to Google and typed in “Toronto real estate.”
I wanted to pretend that I was a novice who intended to learn about real estate in the way that most people would, and thus Google was going to tell me what’s what.
Here are the three stories that popped up in my newsfeed:

So while the “Toronto housing market cools down in May,” we’re also being told that “Toronto home prices hit new all-time record high.”
Can you think of a larger contradiction?
“Leafs play awful, miserable game,” followed by “Toronto beats Winnipeg 10-1.”
What in the world must a novice real estate enthusiast think?
It makes no sense. Absolutely none.
And while I recognize that The Globe & Mail and BlogTO are different publications, it’s hard to separate facts from opinion in the news when two media sources are handed the exact same data and publish completely different takes on the market.
And what of the article in the middle?
“Hardly Anybody Is Buying Condos In Downtown Anymore.”
Really?
Define hardly anybody.
Like, five people? Ten? One hundred?
Surely this headline must be data-driven, so let’s look at the data, shall we?
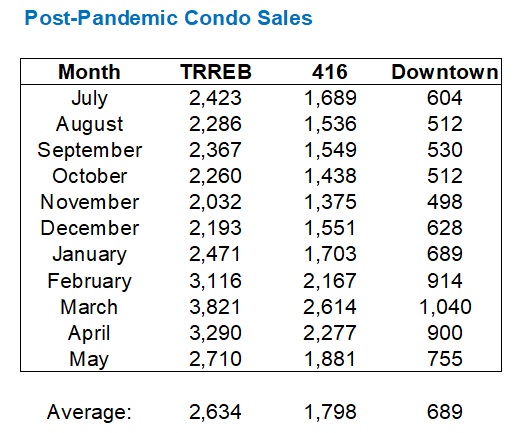
I would consider “downtown” to be C01 and C08, and since I don’t believe for a second that the person who wrote that article for BlogTO has the ability to dig deeper into the data than C01 & C08 (if they bothered to look at data at all…), we’ll use these figures for analysis.
There were 755 condo sales in C01 & C08 in May.
This is less than March and April, which were the #1 and #2 months for sales in the history of TRREB.
But it’s more than the post-pandemic average, and more than every month since last summer, save for Feb/March/April of this year.
So, I ask again, define “hardly anybody.”
It seems to me like this article is clickbait and nothing more.
This isn’t really the story of the May TRREB stats, however.
Having read through the stats twice last week, here are my top-five take-aways…
–
1) Average home price sets another new record
I’m surprised. Aren’t you?
I wrote in this space last month, or perhaps it was my eNewsletter, that I could see the TRREB average home price dipping 1-2%, month-over-month.
Instead, it increased by 1.6%
Here’s where the TRREB average currently stands compared to previous months:
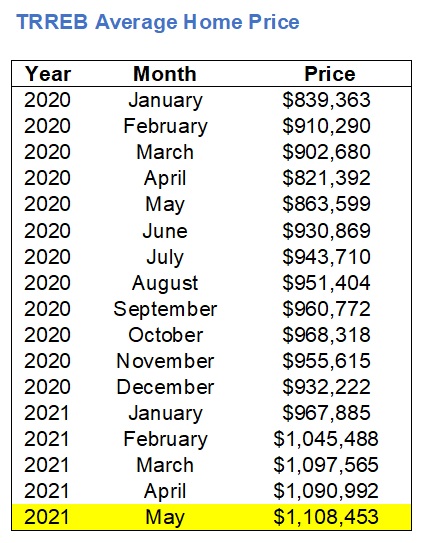
We saw a massive 5.0% increase in the average sale price from February to March, as the figure approached $1.1 Million.
Then last month, the price declined ever-so-slightly by 0.6%.
Now we’re back up again, but past the previous high in March, to $1,108,453.
We’ve now seen three straight months “around” that $1.1M mark, which tells me this isn’t an outlier, but rather a new threshold.
To put this in context, I wouldn’t look at the pandemic-induced year-over-year increase, which sits at 28.4% for May, but rather I’d go back two years and look at the appreciation leel since the $838,540 recorded in May of 2019.
That’s a 32.2% increase in two years. Or 16.1% per year over two years.
Is that level of appreciation really possible, or is this a numbers trick?
The May average home price is up 37.7% in three years, since the $805,320 recorded in May of 2018, which would represent an average of 12.6% per year in those three years.
This appreciation is real, folks. This isn’t inflation, low rates, and mania at play. This level of pricing is here stay.
–
2) Toronto-416 is red-hot…….isn’t it?
While the TRREB average home price declined by 0.6% from the record month of March to April, the 416 actually increased by 0.4% in the same period. Not significant, I know. But when you figure the TRREB price rose by 1.6% last month, and the 416 price rose by 2.6%, suddenly it seems that the 416 is massively outpacing the entire TRREB average.
The 416 is carrying TRREB right now, and while that’s not to say that the 905 is weak, it would be irresponsible not to point out the strength in the 416 (more on this in a moment).
Here’s how the 416 average looks during the same time period:
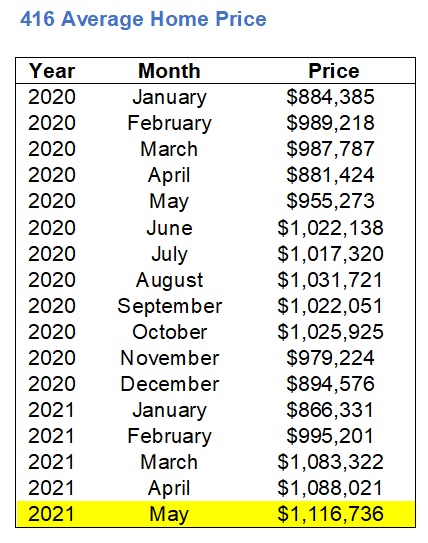
However, and this is a big however, if we compare appreciation rates in the 416 to the TRREB average as we did above, we see a different angle.
As mentioned, the TRREB average home price is up 32.2% in two years as of May.
As for the 416? It’s up 19.1% in the same time period.
Likewise, we noted above that the three-year increase in the TRREB average home price is a whopping 37.7%.
As for the 416? It’s up 29.6%.
So while the 416 numbers show a market that’s out-appreciating the market average so far in 2021, we have to remember that the 416 actually lags the overall average in the past two or three years.
Let’s plot the last few years’s worth of data to look at this from another angle:
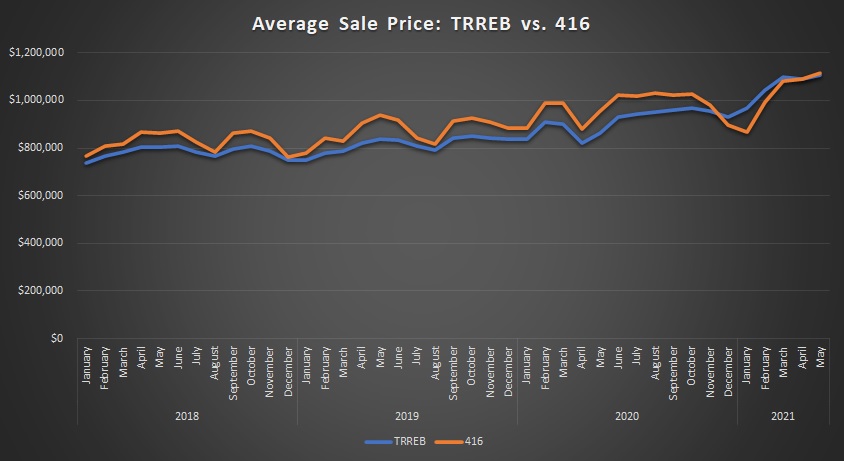
At first glance, most people will likely notice the same thing: the orange line seems to be higher than the blue line for the duration of this time period.
That’s what’s so amazing about the past six months.
The TRREB average and the 416 have essentially pulled even, and this comes after a time when, if you can believe it, the TRREB average was actually higher than the 416 in December, January, and February of 2021.
You can call this the strength of the recent 416 market, or you can call this the weakness of the previous 416 market. Or, I suppose, you could put the shoe on the other foot and talk about the strength of the 905 market in late 2020, but you can make numbers say anything you want so I’m willing to bet we could do this all day.
–
3) Toronto condo prices are holding steady.
Despite what BlogTO wrote last week, I think just about everybody in the market is aware that the condo market is still holding strong.
And I’ll be honest: I wouldn’t have bet money on this!
We went from perhaps the weakest condo market I had ever seen, back in October through December of 2020, to a red-hot condo market in early-2021 that made no sense.
I remember a listing I had last fall in Liberty Village for a 1-bed, 1-bath condo which took me over two weeks to sell, and I scraped and clawed to get $542,000 on the $549,900 asking price. If that condo were for sale in March of 2021, it would have produced 6-12 offers.
So who in their right mind thought the condo market would hold up as we approached the summer?
The average 416 condo price dropped from the record-high set in April, of $727,137, to a figure of $716,976 this past month. That’s the third-highest average sale price in any one month, ever, as February of 2020 holds the #2 spot.
So even though we saw a drop, this past month, that $716,976 figure is still well above the average of the previous six months, which is $667,122.
Maybe pictures don’t paint the best picture here, but try this on for size:
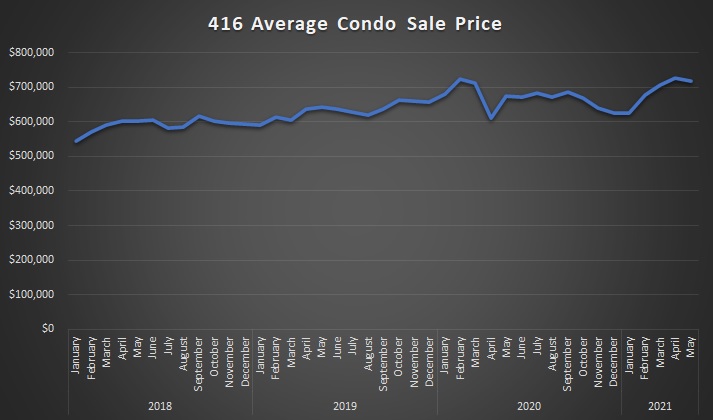
That cliff you see in 2020 is obviously from the pandemic, when the average condo price dropped from $722,675 in February to $612,300 in April. The market came back in the spring, but boy was it ever tough in the fall!
That descending line from September to December does that period no justice. I strongly contend that this was the most sluggish condo market I have ever worked in.
Let’s re-draw the chart at the start of 2020:
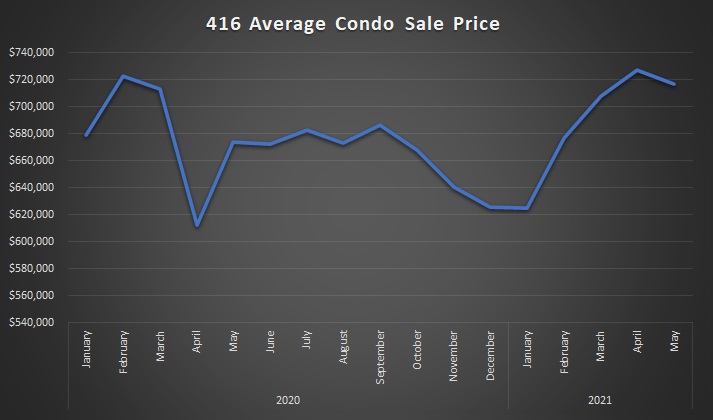
That paints a much better picture.
The drop in March-April of 2020 is sharp, but this is really an on-paper drop, since the market wasn’t all that bad.
It’s that descending line from September to December that really strikes me. That’s how it felt: worse and worse, every month.
But look at 2021! Who’d have thought?
So with the average condo sale price down 1.4%, month-over-month, should we expect that trend to continue? I believe so. I think we might see a slight rollback in the average as we trek through the summer months, but I expect that figure to be over $740,000 this fall.
–
4) Sales remain strong…….or do they?
Once again, this is an excellent example of perspective.
We saw 11,951 sales recorded in the month of May.
That’s the eighth-highest in the history of TRREB.
Look:
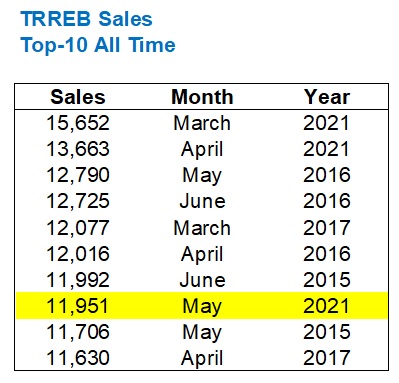
#8 all time?
That’s pretty good company!
So how can anybody in their right mind suggest that this number of recorded sales doesn’t tell the story of a red-hot seller’s market?
Well, I’m in my right mind. Most of the time. So let me take a stab at this…
Let me compare May to May throughout the last twenty years.
Here are the Top-10 months of May, ever:
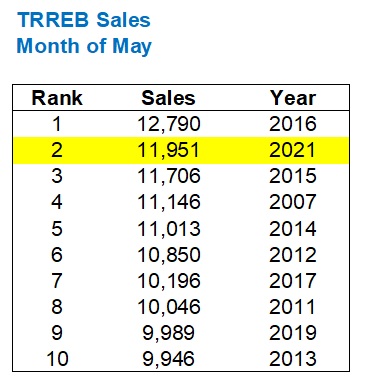
Okay, so it’s the second-best May in the history of TRREB, so again, in very good company.
We have the 8th highest month every.
The 2nd highest month of May.
So how in the world can I turn this around to suggest that May was sluggish?
With this, perhaps:

In the past twenty years, only four times have we seen a drop in sales from April to May, and that includes this year.
Not only that, the 2017 decline is included in the previous three occasions, and while I recognize that we can’t eliminate an example of a declining market because it was in a declining market, I do think this underscores just how rare an April-to-May drop really is.
Once upon a time, May was the busiest month, every year, like clockwork.
I’m not saying that the market is slowing, or is going to slow, but it does look like the data is pointing us in that direction.
–
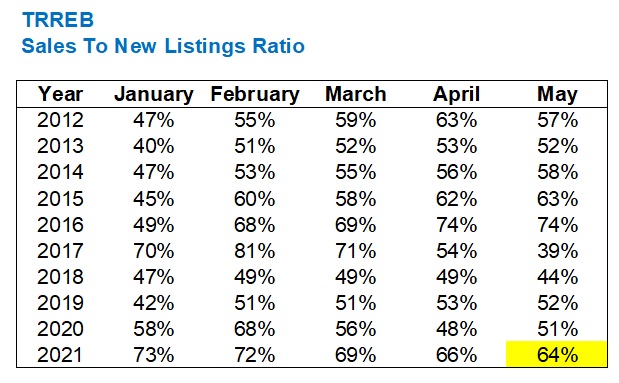
5) Sales-to-New-Listings Ratio: it’s anybody’s guess
I’ll admit, I was looking at the data above and I started to make projections.
Sales dropped from April to May by 12.5%.
New Lisings dropped from April to May by 10.8%.
As a result, Active Listings increased by 5.0%.
If I had to guess, I’d think that “sales to new listings” ratio, or SNLR, dropped substantially. Furthermore, I would expect that in previous years, the SNLR actually increased from April to May.
Here’s what I found:
You can draw many different conclusions from this data, so long as you have an opinion, a keen eye, and the ability to back up your stance.
But I’ll tell you what I see:
1) The 64% SNLR this past month is the highest in any month of May since 2016, and it’s the second-highest in the last decade.
2) The SNLR decreased by 2%, month-over-month, but in the previous nine years, the SNLR increased three times, decreased five times, and remained the same once.
3) The SNLR for all months in 2021 is well ahead of 2018, 2019, and 2020.
4) The SNLR increased, year-over-year, by 15%, 14%, 13%, 18%, and 13% in January, February, March, April, and May respectively.
Conclusions?
While I expected to see a surge in inventory this month and perhaps a sharply-declining SNLR, we’re just not seeing it.
Sure, the 64% SNLR from May is the lowest of 2021, and the 13% increase on a year-over-year basis ties March for the least in 2021, we can’t ignore that 64% creates a very, very tight market!
Recall the talk of 2021 being like 2017 when the year began. I even wrote a blog about this!
But in 2017, the SNLR went from 81% in February, to 71% in March, then down to 54% in April, and 39% in May.
In 2021, the SNLR has held steady: 72% in February, to 69% in March, then down to 66% in April, and finally 64% in May.
All those predictions of 2021 being like 2017? Just wishful thinking from sideline-sitting market bears.
–
Damn, this was long!
And I think about those readers that are like, “Ew, I don’t read the stats blogs. Booo-ring! Too many numbers, yuck!”
(single tear drips down cheek….)
Hey, how’s the rental market anyways?


Marty
at 9:16 am
I see all those headlines. And I read the articles sometimes.
My job doesn’t really require me to be right up on the trends and statistics, but I do meet with or talk to sometimes dozens of Realtors each week in my work. And I do not want to call it “small talk”, but I like to be informed if we do talk shop on those topics.
So I come here 3x per week. And I’ve only met one or two Realtors out there that are not familiar with this blog, when I say “I try to keep up with things by reading David Fleming’s blog”.
So here is where this newbie comes for news.
Appraiser
at 9:37 am
Great data Dave, as usual.
Also have to admit that I thought we would see a rush of listings by now. Yet inventory remains chronically low.
If only there was something we could do to increase housing supply.
(P. S. Hey, what happened to all the bears) ?
David Fleming
at 10:09 am
@ Appraiser
One prediction I neglected to make: New Listings will skyrocket in June. A lot of properties aren’t selling on offer night and are being re-listed. We’re going to see a lot more “new listings” for properties already listed!
Bal
at 12:43 pm
David – Just curious. Are you here talking about Condos or freehold houses? So far i am still seeing over asking in my three fav locations ( Dundas and Trafalgar( Oakville), Financial drive Brampton and countryside / Macvean, Brampton
Bal
at 11:16 am
we are pretty much here….but if data is against us…what we can do other than just let you enjoy your time…..????…and knowing you …i knew you are gonna jump up and down…lol
Professional Shanker
at 10:03 am
Bears got tired and are hibernating…..
Chris
at 4:17 pm
The S&P500 has now seen three straight months “around” the 4,000 mark, which tells me this isn’t an outlier, but rather a new threshold.
To put this in context, I wouldn’t look at the pandemic-induced year-over-year increase, which sits at 32.5%, but rather I’d go back two years and look at the appreciation leel since the 2,873 recorded in June of 2019.
That’s a 47.1% increase in two years. Or 23.6% per year over two years (or, a CAGR of 21.3%).
Is that level of appreciation really possible, or is this a numbers trick?
The S&P500 is up 54.6% in three years, since the 2,734 recorded in June of 2018, which would represent an average of 18.2% per year in those three years (CAGR of 15.6%).
This appreciation is real, folks. This isn’t inflation, low rates, and mania at play. This level of pricing is here to stay.
JL
at 7:54 pm
I see what you did there… = )
Not that I disagree; these certainly are very weird times for all asset classes.
Chris
at 8:39 pm
Very strange times. I wouldn’t be claiming that any asset’s “pricing is here to stay”, given current conditions.
Bal
at 9:21 am
Agreed with Chris…stock market is also gone crazy just like RE….i have zero knowledge of stocks but bcz i invested last year…i made money and now i am thinking i am a stock guru ….lollol…
Chris
at 12:34 pm
Nice, Bal, glad to hear you made some money in the stock market!
Appraiser
at 7:50 am
“Cecil Graham: What is a cynic?
Lord Darlington: A man who knows the price of everything, and the value of nothing.
― Oscar Wilde, Lady Windermere’s Fan
Chris
at 8:30 am
“Quotation is a serviceable substitute for wit.”
– William Somerset Maugham
Bal
at 6:56 pm
Yep Chris I am happy too….Thanks though
Pragma
at 11:48 am
Very nicely done. I would argue it is 100% low rates and mania related. It is the exact same factors driving equity markets. And if people are worried about stock markets, about the high likelihood of inflation being more than just “transitory”, about rates having no choice but to grind higher, how can you not worry about any asset price that has jumped 30% in one year. I love these kind of predictions that become rampant in the late stages. “New floor in the NASDAQ” “Bitcoin $100,000 by year end”
Chris
at 12:43 pm
Absolutely. As I’ve said before, assets of all stripes seem to have had their valuations inflated thanks to very loose monetary and fiscal policy.
If inflation proves more lasting, monetary stimulus is withdrawn and interest rates rise, I don’t think “pricing is here to stay” for any asset class, be it the S&P500, Bitcoin, AMC shares, Grey Bruce homes or Toronto condos.
Professional Shanker
at 10:09 am
We have been through this song and dance before, interest rates cannot grind higher with the level of debt issued without a generational reset for all assets triggered.
Inflation will prove to be little more than transitionary once monetary stimulus is slowly withdrawn.
Chris
at 4:51 pm
Central banks base their rate decisions on inflation data, not asset valuations. Higher rates will put pressure on all asset classes, but if inflation remains high, I don’t see what choice they’ll have.
As for inflation, Brian Chang wrote a great, if lengthy, piece on how it is driven much more by fiscal stimulus than monetary stimulus.
https://crusoeeconomics.com/2021/05/26/inflation-asset-prices-and-the-policy-mechanism-explained/
It looks like both Trudeau and Biden have no intention of turning off the stimulus taps anytime soon, so we very well may see inflation run hotter than expected. Or, maybe we won’t. Predictions on where CPI moves are all over the map these days.
Papa
at 11:03 am
Just curious and posing this question to all readers of Realtyblog to get your opinion.
Do you believe lower floor condos are more valuable now to avoid using elevators due to covid?
Bal
at 11:31 am
I still like the view…one side is city view and other cite is lake……:)..otherwise i won’t buy condo…lol
cyber
at 4:58 pm
No. COVID is temporary, views are ‘forever’ (until another condo is built across the street).
There’s may be a slightly higher % of folks, relative to pre-pandemic, who may have somewhat of a preference towards a low-mid floor, say 7-14, which have enough of a distance from the ground but are not too much of an effort to take the stairs when elevators invariably go out of service. But not enough to impact pricing in a meaningful way.