Remove charts
article thumbnail

The chart guy, Logan Mohtashami, to headline HW Annual

Housing Wire

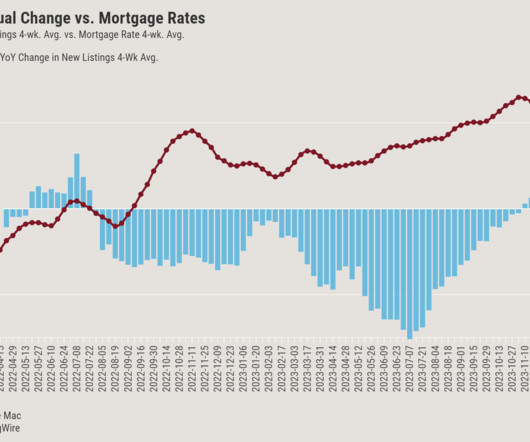
Did you know Logan Mohtashami — the chart guy — got his professional start working as a pizza boy? Meanwhile in 2023 specifically, Mohtashami has learned to, “never lose his passion for making charts,” as attendees will see firsthand at HW Annual. Twitter trolls beware.

Mortgages 374
article thumbnail

Mortgage rates increase to 3.12% as Fed charts new course

Housing Wire

The post Mortgage rates increase to 3.12% as Fed charts new course appeared first on HousingWire. “Fewer homeowners have a strong incentive to refinance at current rates,” Joel Kan, the MBA’s associate vice president of economic and industry forecasting, said in a statement.

Insiders

Sign Up for our Newsletter

This site is protected by reCAPTCHA and the Google Privacy Policy and Terms of Service apply.

article thumbnail

HomeServices Targets New Trial Date; Keller Williams Charts Path Forward

RIS Media

According to a filing in federal court on Monday, March 25, the company is aiming for a trial starting… The post HomeServices Targets New Trial Date; Keller Williams Charts Path Forward appeared first on RISMedia.

As-is 117
article thumbnail

6 charts that illuminate the latest existing-home sales data

Inman

In a series of key charts, Aziz Sunderji of Home Economics and Mike DelPrete, a strategic adviser and global expert in real estate technology, put August existing-home sales in historical context.

Sales 169
article thumbnail

Sunbelt Surge: 15 Cities Dominating the Growth Charts

Bigger Pockets

Simply investing in any metro Sunbelt market is not a recipe for success. To catch a cresting wave of appreciation and cash flow, you’ll need to dive deep into the metrics […]

Marketing 111
article thumbnail

Louisville Home Sales Chart, Updated

Louisville Homes

We haven’t published as many real estate market charts in recent years. So here’s the newly updated Louisville home sales chart for the period 2002 through 2021. Louisville home sales chart updated through 2021. The post Louisville Home Sales Chart, Updated appeared first on Louisville Homes Blog.

Sales 98
article thumbnail

Federal Reserve Interest Rates History & Chart [1910s-2020s]

Marco Santarelli

Federal Reserve Interest Rates Chart To better understand the history of Federal Reserve interest rates, it can be helpful to view this information in a visual format. This chart provides a comprehensive view of how interest rates have fluctuated over time, allowing for a deeper understanding of the impact of policy decisions on the economy.

Banks 97