The U.S. Census Bureau released their new residential construction report for April, showing a miss on the estimate and a negative revisions data line, which I believe is lagging behind the current market reality. Housing starts came in at 1.724 million, and housing permits came in at 1.819 million — both are still very healthy numbers.
However, the sting of higher mortgage rates is hitting the single-family construction data, and the real story is that the housing completion data, which has been bad for a long time, is still terrible. We simply cannot finish homes in America promptly, and now that mortgage rates are over 5%, some buyers won’t be able to purchase a home.
The builders are mindful of this and will be cautious on single-family starts.
In the summer of 2020, I wrote that what would cool down housing is having the 10-year yield go over 1.94%, which means 4%+ mortgage rates. While historically low, 4%-5% and higher mortgage rates have constantly cooled down housing, especially when working from a solid uptrend. This happened in 2013-2014, and in 2018 when mortgage rates moved toward 5%.
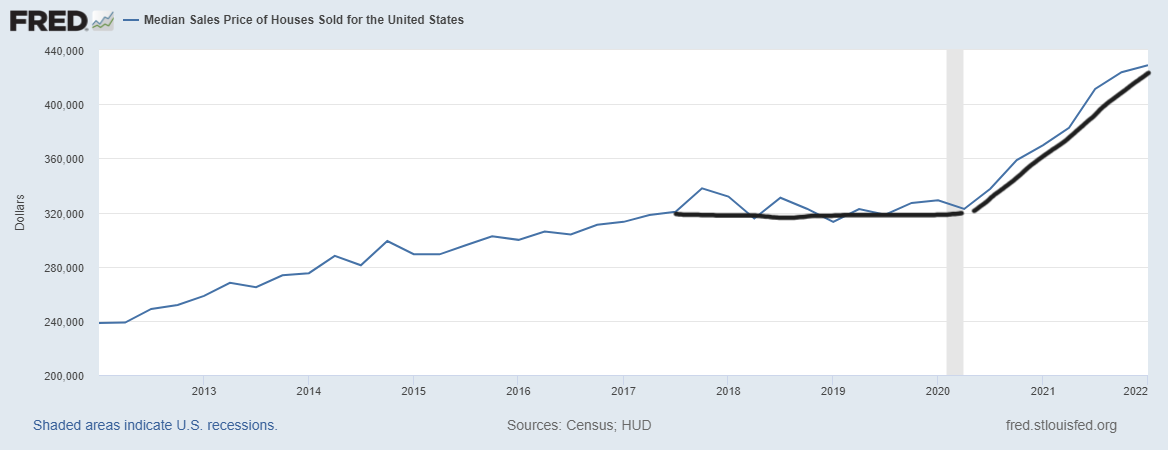
Housing in 2020 and 2021 benefited from rates between 2.5% – 3.75%, which gave buyers more purchasing power. After the big run-up in home prices over the last year, 5%+ mortgage rates are a payment shock. So, this is a traditional slowdown we see, not a housing crash. As you can see below, the builders pushed their pricing power and made their margins look great, even with higher lumber and labor costs.
From Census: Privately‐owned housing starts in April were at a seasonally adjusted annual rate of 1,724,000. This is 0.2 percent (±8.7 percent)* below the revised March estimate of 1,728,000, but is 14.6 percent (±14.2 percent) above the April 2021 rate of 1,505,000. Single‐family housing starts in April were at a rate of 1,100,000; this is 7.3 percent (±7.7 percent)* below the revised March figure of 1,187,000. The April rate for units in buildings with five units or more was 612,000.
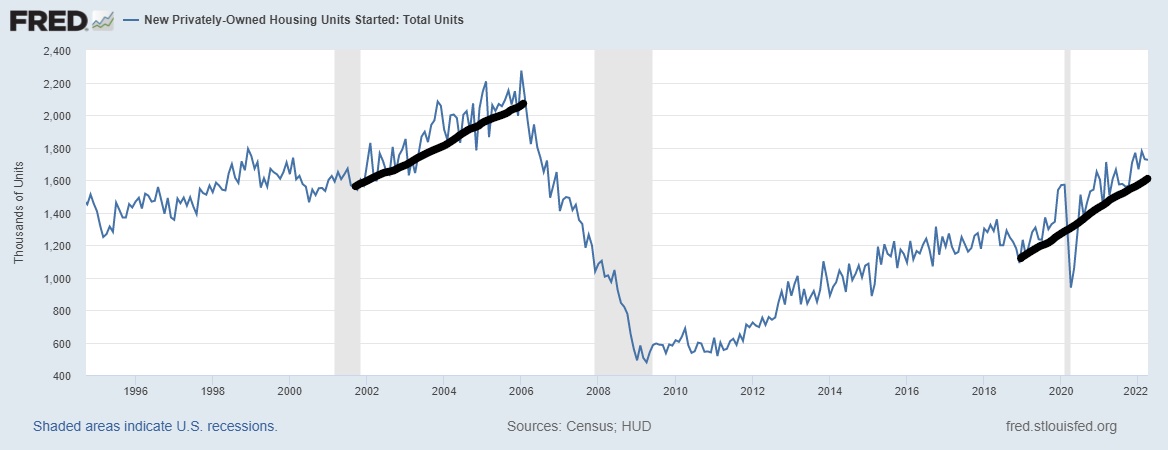
As you can see below, the housing demand data from 2002 to 2005 was never apparent in any housing data lines from 2018 to 2022. When you don’t have a credit boom with exotic loan debt products, housing demand has limits. This is a huge positive for the U.S. housing economy because the demand curve we have had in America is more accurate. This demand curve prevents a boom and bust cycle from happening, as we saw from 2002 to 2008.
From Census: Privately‐owned housing units authorized by building permits in April were at a seasonally adjusted annual rate of 1,819,000. This is 3.2 percent below the revised March rate of 1,879,000 but is 3.1 percent above the April 2021 rate of 1,765,000. Single-family authorizations in April were at 1,110,000; this is 4.6 percent below the revised March figure of 1,163,000. Authorizations of units in buildings with five units or more were at a rate of 656,000 in April.
The housing starts story in 2022 is that while demand has gotten softer for single-family starts, multifamily construction has been a good thing this year. With rent inflation high and supply low, shelter construction for the renting side of the housing market has more legs, whereas higher mortgage rates are impacting single-family construction plans.

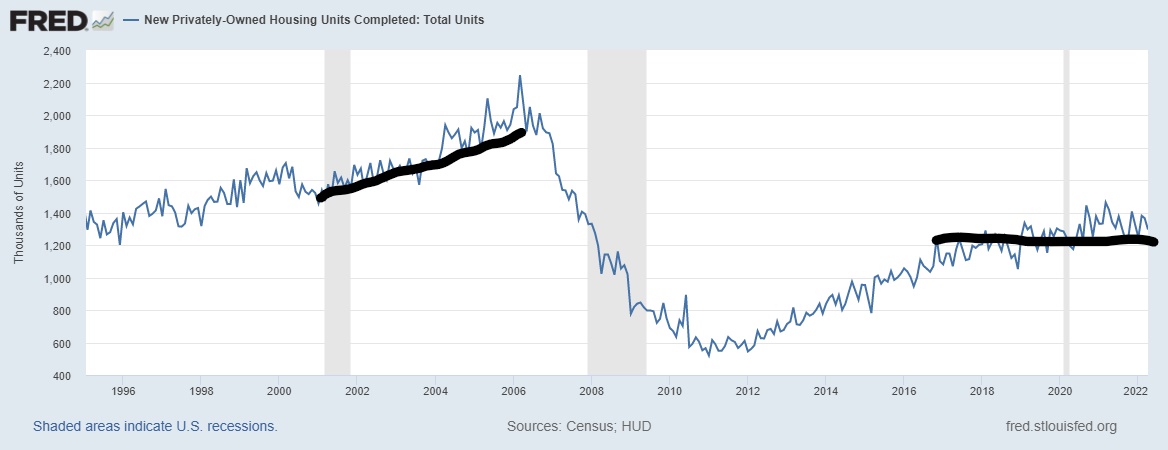
From Census: Housing Completions Privately‐owned housing completions in April were at a seasonally adjusted annual rate of 1,295,000. This is 5.1 percent (±11.5 percent)* below the revised March estimate of 1,365,000 and is 8.6 percent (±7.5 percent) below the April 2021 rate of 1,417,000. Single‐family housing completions in April were at a rate of 1,001,000; this is 4.9 percent (±14.1 percent)* below the revised March rate of 1,053,000. The April rate for units in buildings with five units or more was 281,000.
It’s the worst timing possible in history. It takes forever to finish a home, and now the builders are dealing with the reality of borrowers who went into contract with sub-4% rates and are now dealing with 5%+ rates. Nothing has been easy in housing since 2020. Now that mortgage rates have been in real terms a 3% increase from the shallow bottom we saw during the COVID-19 recovery, some contract sales are at risk.
Today wasn’t a terrible housing starts report, but the data is currently lagging behind the reality of the big mortgage rate move and the uncertainty of how many of those housing units will be sold. The builders know this as their confidence data is already fading and remember, with this data line, the rate of change is more important than where the data line is today on a historical level.
From the National Association of Home Builders:

For the future, the key is how many single-family homes in contract will be lost due to the mortgage rate moving higher and how much damage higher mortgage rates do to future housing demand. Much of the housing data lags behind the big rate move, but we are coming to an end of that reality so that the upcoming months will reflect the current state better.
The one positive data line that we have seen is multifamily construction, which is desperately needed as rental inflation has taken many Americans by surprise. Renters don’t have the protection of a fixed debt loan like homeowners do. As we can all see, the housing inflation story is hitting Americans on both the home-buying and rental side of the equation, hence my theme of a savagely unhealthy housing market.